2018 QUARTER 01

A B C D E F G H I K L M N O P R S T U V W
AM-15 - Calculating surface derivatives
  • List the likely sources of error in slope and aspect maps derived from digital elevation models (DEMs) and state the circumstances under which these can be very severe
  • Outline how higher order derivatives of height can be interpreted
  • Explain how slope and aspect can be represented as the vector field given by the first derivative of height
  • Explain why the properties of spatial continuity are characteristic of spatial surfaces
  • Explain why zero slopes are indicative of surface specific points such as peaks, pits, and passes, and list the conditions necessary for each
  • Design an algorithm that calculates slope and aspect from a triangulated irregular network (TIN) model
  • Outline a number of different methods for calculating slope from a DEM
KE-10 - Capital: facilities and equipment
  • Identify the hardware and space that will be needed for a GIS implementation
  • Compare and contrast the relative merits of housing GISs within IT (information technology) and MIS (management information system) facilities versus keeping them separate
  • Collaborate effectively with various units in an institution to develop efficient hardware and space solutions
  • Hypothesize the ways in which capital needs for GIS may change in the future
CV-32 - Cartograms

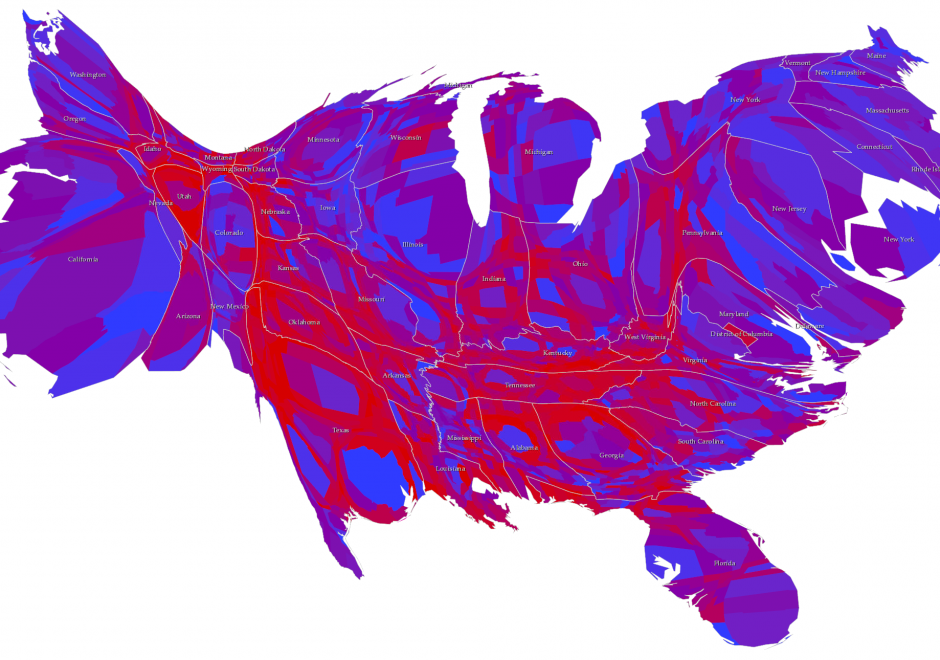
Cartograms are used for thematic mapping. They are a particular class of map type where some aspect of the geometry of the map is modified to accommodate the problem caused by perceptually different geographies. Standard thematic maps, such as the choropleth, have inherent biases simply due to the fact that areas will likely be very different in size from one another. The tendency to see larger areas as more important, regardless of the variable being mapped, can cause confusion. Cartograms tackle this by modifying the geography, effectively normalizing it to create a map where each area takes on a new shape and/or size based on the variable being mapped. Cartograms therefore depict geographical space diagrammatically as they lose their relationship with true coordinate system geometry. There are four main types of cartogram which each represent the mapped variable differently – non-contiguous, contiguous, graphical and gridded.  

AM-12 - Cartographic modeling
  • Describe the difference between prescriptive and descriptive cartographic models
  • Develop a flowchart of a cartographic model for a site suitability problem
  • Discuss the origins of cartographic modeling with reference to the work of Ian McHarg
CV-27 - Cartography and Art

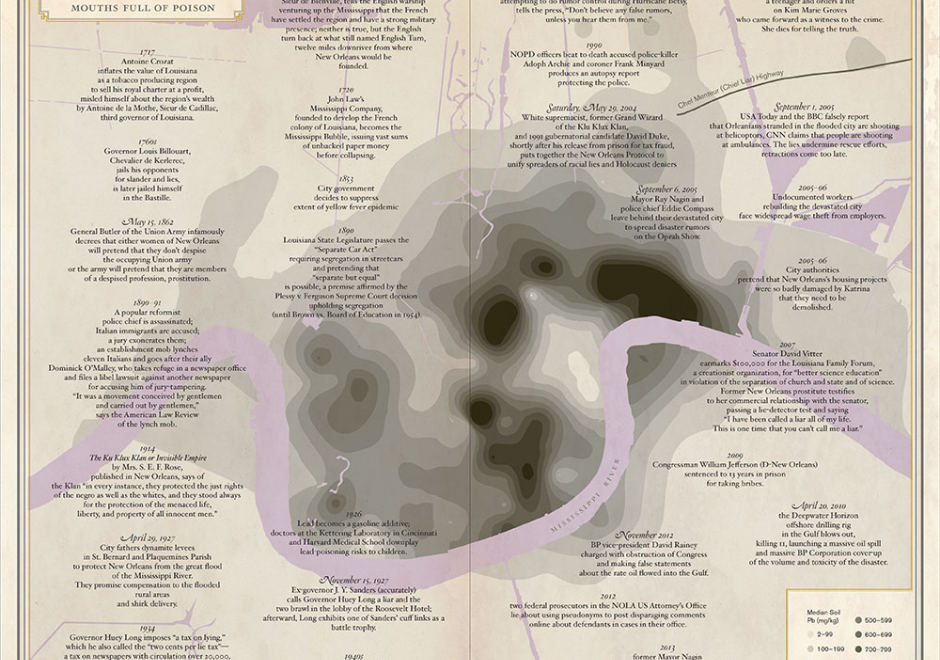
The intersections between art and cartography go far beyond the notions of design and illustration, since mapmaking invariably has multiple cultural, social, and political dimensions. Considering this broader perspective, this entry provides a review of these different contemporary intersections, by exploring three main types of relationships: 1) cartography influenced by artistic practices; 2) map art or maps embedded in artistic practices; and 3) cartography at the interface between art and places. These will be discussed in detail following a brief overview of the main historical markers from which these types of relationships between art and cartography have emerged.

CV-26 - Cartography and Power

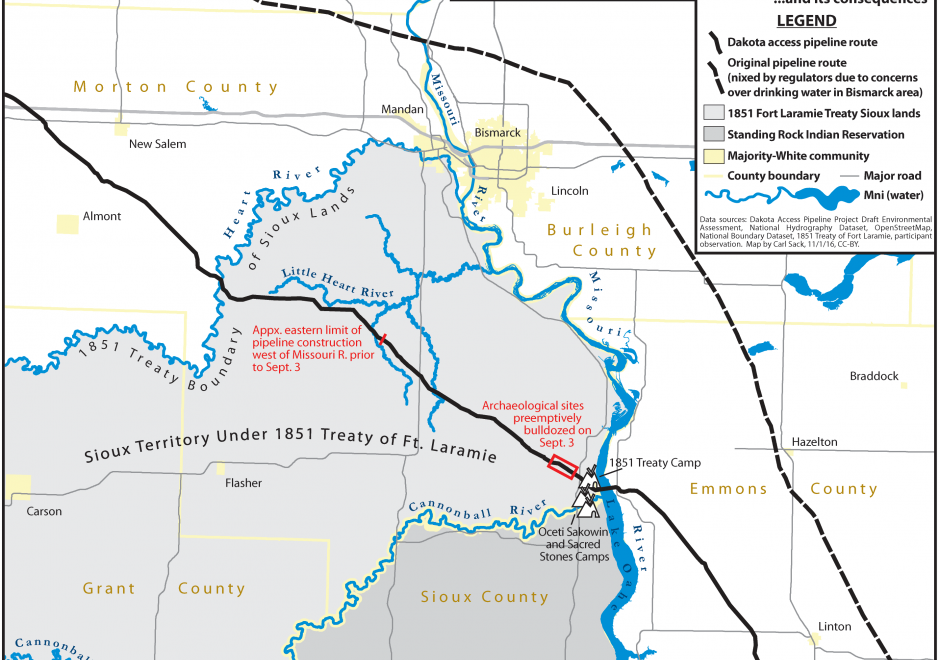
Over twenty five years ago, Brian Harley (1989, p. 2) implored cartographers to “search for the social forces that have structured cartography and to locate the presence of power – and its effects – in all map knowledge.” In the intervening years, while Harley has become a bit of a touchstone for citational practices acknowledging critical cartography (Edney, 2015), both theoretical understandings of power as well as the tools and technologies that go into cartographic production have changed drastically. This entry charts some of the many ways that power may be understood to manifest within and through maps and mapmaking practices. To do so, after briefly situating work on cartography and power historically, it presents six critiques of cartography and power in the form of dialectics. First, building from Harley’s earlier work, it defines a deconstructivist approach to mapping and places it in contrast to hermeneutic phenomenological approaches. Second, it places state-sanctioned practices of mapping against participatory and counter-mapping ones. Third, epistemological understanding of maps and their affects are explored through the dialectic of the map as a static object versus more processual, ontogenetic understandings of maps. Finally, the chapter concludes by suggesting the incomplete, heuristic nature of both the approaches and ideas explored here as well as the practices of critical cartography itself. Additional resources for cartographers and GIScientists seeking to further explore critical approaches to maps are provided.

CV-01 - Cartography and Science
  • Discuss the perspectives of Brian Harley and others on the political motivation for the development of certain kinds of maps
  • Discuss the Swiss influence on map design and production, highlighting Imhof’s contributions
  • Outline the development of some of the major map projections (e.g., Mercator, Gnomonic, Robinson)
  • Explain how Bertin has influenced trends in cartographic symbolization
  • Explain how technological changes have affected cartographic design and production
  • Explain the impact of advances in visualization methods on the evolution of cartography
  • Compare and contrast cartographic developments in various countries and world regions such as Switzerland, France, China, the Middle East, and Greece
  • Discuss the influence of some cartographers of the 16th and 17th centuries (Mercator, Ortelius, Jansson, Homann and others)
  • Describe how compilation, production, and distribution methods used in map-making have evolved
  • Describe how symbolization methods used in map-making have evolved
  • Describe the contributions by Robinson, Jenks, Raisz, and others to U.S. academic cartography
  • Discuss the relationship between the history of exploration and the development of a more accurate map of the world
CV-02 - Cartography and Technology
  • Discuss the impact that mapping on the Web via applications such as Google Earth have had on the practice of cartography
  • Explain how emerging technologies in related fields (e.g., the stereoplotter, aerial and satellite imagery, GPS and LiDAR, the World Wide Web, immersive and virtual environments) have advanced cartography and visualization methods
  • Explain how MacEachren’s Cartography-cubed (C3) concept can be used to understand the evolving role of cartography and visualization
  • Explain how software innovations such as Synagraphic Mapping System (SYMAP), Surfer, and automated contouring methods have affected the design of maps
  • Evaluate the advantages and limitations of various technological approaches to mapping
  • Select new technologies in related fields that have the most potential for use in cartography and visualization
DM-25 - Categories
  • Explain the human tendency to simplify the world using categories
  • Identify specific examples of categories of entities (i.e., common nouns), properties (i.e., adjectives), space (i.e., regions), and time (i.e., eras)
  • Explain the role of categories in common-sense conceptual models, everyday language, and analytical procedures
  • Recognize and manage the potential problems associated with the use of categories (e.g., the ecological fallacy)
  • Construct taxonomies and dictionaries (also known as formal ontologies) to communicate systems of categories
  • Describe the contributions of category theory to understanding the internal structure of categories
  • Document the personal, social, and/or institutional meaning of categories used in GIS applications
  • Create or use GIS data structures to represent categories, including attribute columns, layers/themes, shapes, and legends
  • Use categorical information in analysis, cartography, and other GIS processes, avoiding common interpretation mistakes
  • Reconcile differing common-sense and official definitions of common geospatial categories of entities, attributes, space, and time
AM-69 - Cellular Automata

Cellular automata (CA) are simple models that can simulate complex processes in both space and time. A CA consists of six defining components: a framework, cells, a neighborhood, rules, initial conditions, and an update sequence. CA models are simple, nominally deterministic yet capable of showing phase changes and emergence, map easily onto the data structures used in geographic information systems, and are easy to implement and understand. This has contributed to their popularity for applications such as measuring land use changes and monitoring disease spread, among many others.

Pages