Cartography and Visualization

The Cartography & Visualization section encapsulates competencies related to the design and use of maps and mapping technology. This section covers core topics of reference and thematic maps design, as well as the emerging topics of interaction design, web map design, and mobile map design. This section also covers historical and contemporary influences on cartography and evolving data and critical considerations for map design and use.  

Topics in this Knowledge Area are listed thematically below. Existing topics are in regular font and linked directly to their original entries (published in 2006; these contain only Learning Objectives). Entries that have been updated and expanded are in bold. Forthcoming, future topics are italicized

History & Trends Map Design Techniques Interactive Design Techniques
Cartography & Science Common Thematic Map Types User Interface and User Experience (UI/UX) Design
Cartography & Art Multivariate Mapping Web Mapping
Cartography & Power Spatio-Temporal Representation Virtual & Immersive Environments
  Representing Uncertainty Big Data Visualization
  Terrain Representation Mobile Maps & Responsive Design
Data Considerations Cartograms Usability Engineering & Evaluation
Vector Formats & Sources Map Icon Design Geovisual Analytics
Raster Formats & Sources Narrative & Storytelling Geovisualization
  Flow Maps  
Map Design Fundamentals  Collaborative Cartography  
Scale & Generalization Map Use  
Statistical Mapping (Enumeration, Normalization, Classification) Lesson Design in Cartography Education  
Map Projections Map Reading  
Visual Hierarchy & Layout Map Interpretation  
Symbolization & the Visual Variables Map Analysis  
Color Theory    
Typography    
Design and Aesthetics    
Map Production and Management    


CV-25 - Metadata, Quality, and Uncertainty
  • Describe a scenario in which possible errors in a map may impact subsequent decision making, such as a land use decision based on a soils map
  • Evaluate the uncertainty inherent in a map
  • Compare the decisions made using a map with a reliability overlay from those made using a map pair separating data and reliability, both drawn from the same dataset
  • Critique the assumption that maps can or should be “accurate”
CV-40 - Mobile Maps and Responsive Design
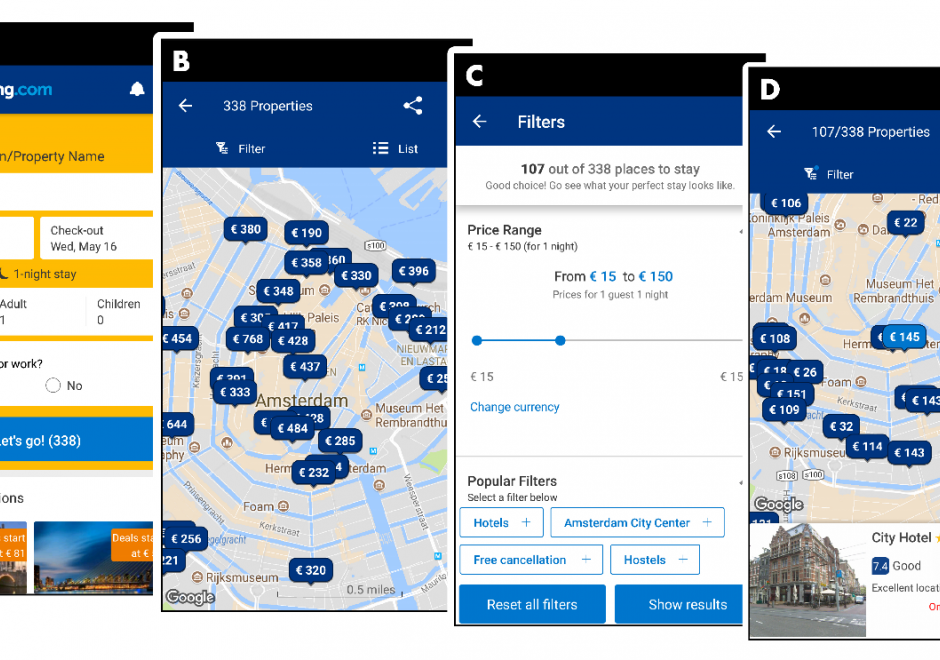
Geographic information increasingly is produced and consumed on mobile devices. The rise of mobile mapping is challenging traditional design conventions in research, industry, and education, and cartographers and GIScientists now need to accommodate this mobile context. This entry introduces emerging design considerations for mobile maps. First, the technical enablements and constraints that make mobile devices unique are described, including Global Positioning System (GPS) receivers and other sensors, reduced screensize and resolution, reduced processing power and memory capacity, less reliable data connectivity, reduced bandwidth, and physical mobility through variable environmental conditions. Scholarly influences on mobile mapping also are reviewed, including location-based services, adaptive cartography, volunteered geographic information, and locational privacy. Next, two strategies for creating mobile maps are introduced—mobile apps installed onto mobile operating systems versus responsive web maps that work on mobile and nonmobile devices—and core concepts of responsive web design are reviewed, including fluid grids, media queries, breakpoints, and frameworks. Finally, emerging design recommendations for mobile maps are summarized, with representation design adaptations needed to account for reduced screensizes and bandwidth and interaction design adaptations needed to account for multi-touch interaction and post-WIMP interfaces.

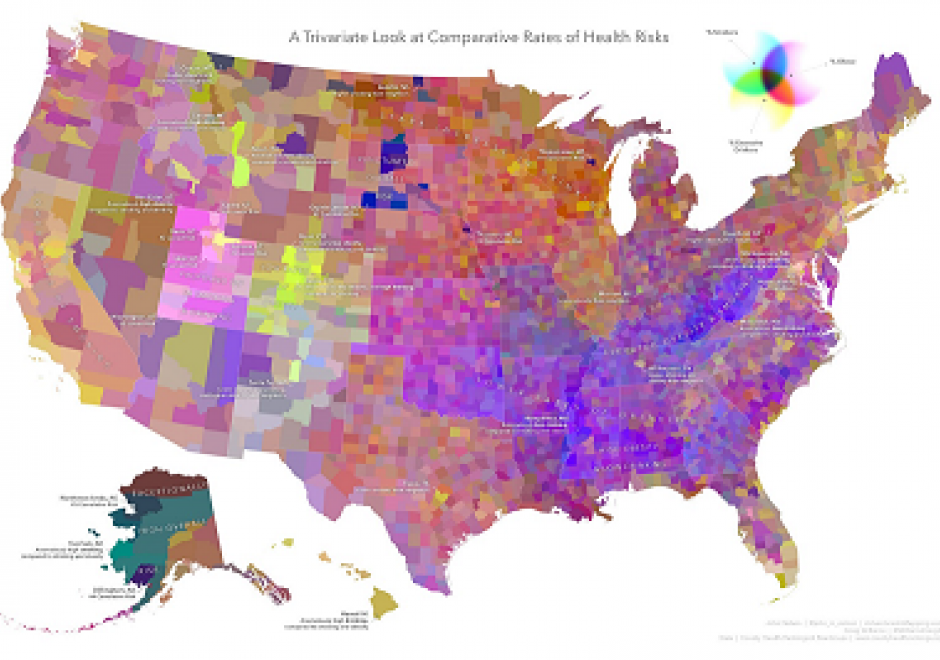
CV-12 - Multivariate Mapping

Bivariate and multivariate maps encode two or more data variables concurrently into a single symbolization mechanism. Their purpose is to reveal and communicate relationships between the variables that might not otherwise be apparent via a standard single-variable technique. These maps are inherently more complex, though offer a novel means of visualizing the nuances that may exist between the mapped variables. As information-dense visual products, they can require considerable effort on behalf of the map reader, though a thoughtfully-designed map and legend can be an interesting opportunity to effectively convey a comparative dimension.

This chapter describes some of the key types of bivariate and multivariate maps, walks through some of the rationale for various techniques, and encourages the reader to take an informed, balanced approach to map design weighing information density and visual complexity. Some alternatives to bivariate and multivariate mapping are provided, and their relative merits are discussed.

CV-33 - Narrative and Storytelling

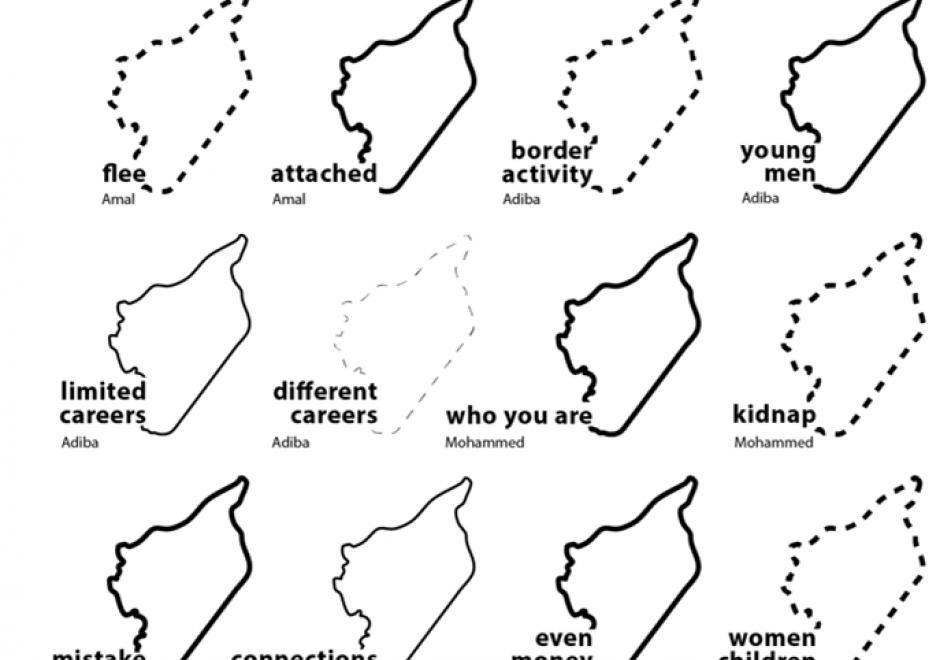
Maps are powerful storytellers. Maps have a long history combining spatial relations with cartographic language to locate, analyze, ground, and express stories told across time and space. Today, “story maps” are increasingly visible in cartography, GIScience, digital humanities, data visualization, and journalism due to the volume of available data and increasingly accessible mapping tools. Perhaps, most importantly, maps present world views and much larger (often hidden) stories or “meta-narratives.” These underlying stories often emerge from dominant perspectives that are deeply informed by power structures like racism, patriarchy, ableism, etc. and further generate uneven geographies. Attention to power in narrative and storytelling reveals and gives voice to alternative storylines and perspectives that can be woven together across time and space. In this entry, I introduce multiple conceptualizations of maps and stories from cartography and data journalism to feminist mapping, Black geographies, and decolonial mapping to illustrate the power of narrative and storytelling in mapping. I argue that understanding the power of narrative and storytelling in mapping is an essential skillset for students and professionals alike.

CV-20 - Raster Formats and Sources

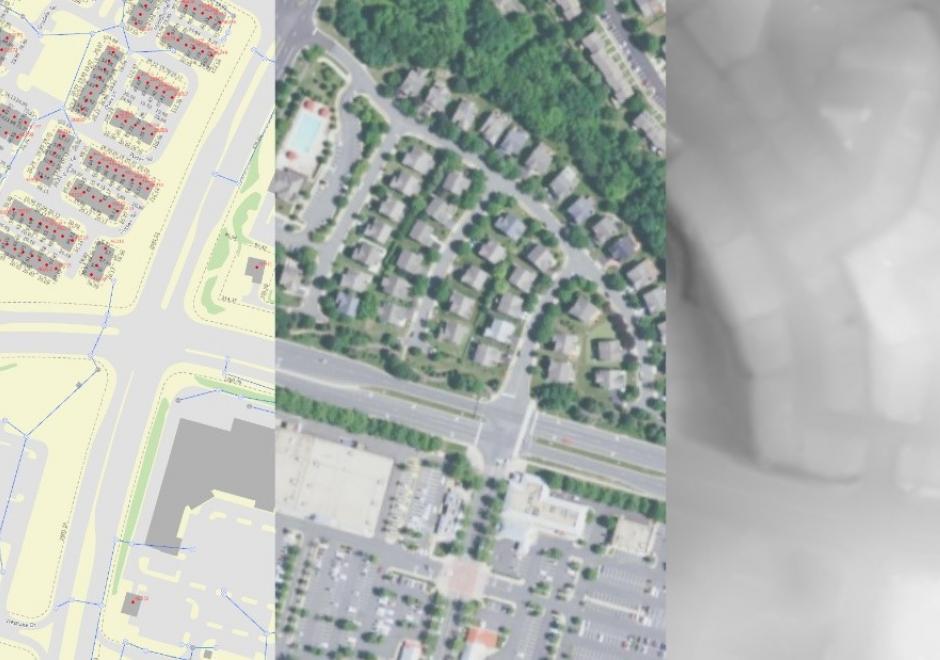
Raster data is commonly used by cartographers in concert with vector data. Choice of raster file format is important when using raster data or producing raster output from vector data. Raster formats are designed for specific purposes and have limitations in color representation and data loss. The simplest raster formats are just a single two-dimensional array of pixels, where multi-band raster datasets use additional data values to represent color or other data. The article covers considerations for the intended use of raster formats. Formats and resolutions appropriate for the web may not be appropriate for print or higher resolution devices. Several types of raster sources are available including single band measures, imagery, and existing raster maps or basemaps. The future of raster will evolve as more formats, sources, and computational improvements are made.

CV-18 - Representing Uncertainty

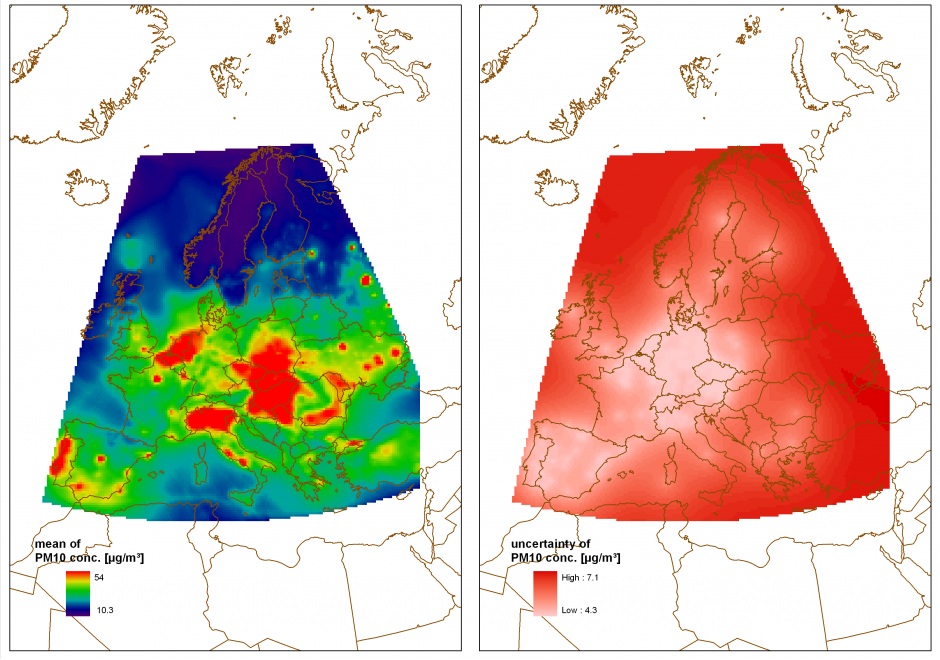
Using geospatial data involves numerous uncertainties stemming from various sources such as inaccurate or erroneous measurements, inherent ambiguity of the described phenomena, or subjectivity of human interpretation. If the uncertain nature of the data is not represented, ill-informed interpretations and decisions can be the consequence. Accordingly, there has been significant research activity describing and visualizing uncertainty in data rather than ignoring it. Multiple typologies have been proposed to identify and quantify relevant types of uncertainty and a multitude of techniques to visualize uncertainty have been developed. However, the use of such techniques in practice is still rare because standardized methods and guidelines are few and largely untested. This contribution provides an introduction to the conceptualization and representation of uncertainty in geospatial data, focusing on strategies for the selection of suitable representation and visualization techniques.

CV-04 - Scale and Generalization

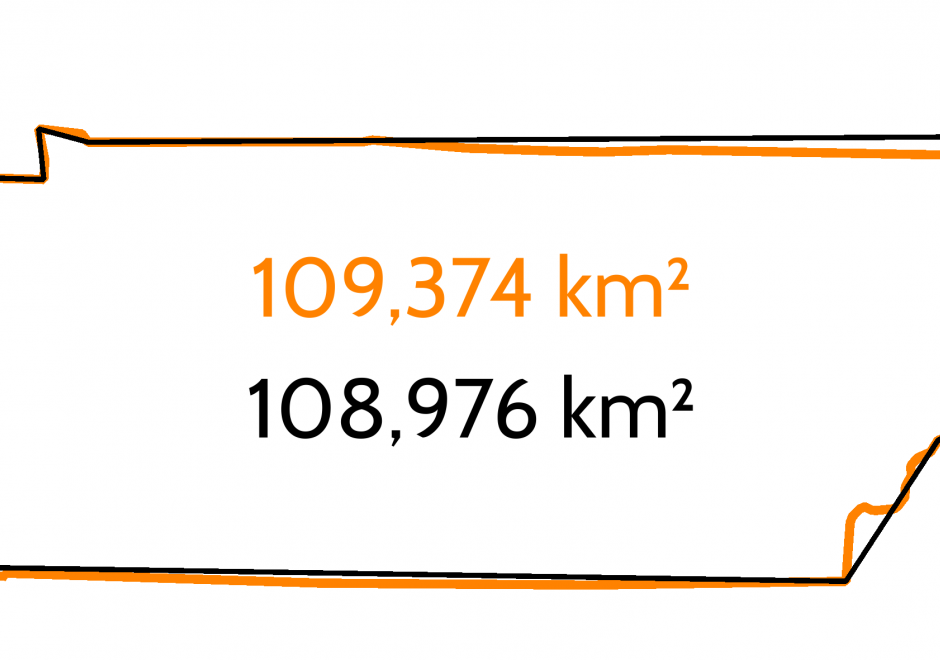
Scale and generalization are two fundamental, related concepts in geospatial data. Scale has multiple meanings depending on context, both within geographic information science and in other disciplines. Typically it refers to relative proportions between objects in the real world and their representations. Generalization is the act of modifying detail, usually reducing it, in geospatial data. It is often driven by a need to represent data at coarsened resolution, being typically a consequence of reducing representation scale. Multiple computations and graphical modication processes can be used to achieve generalization, each introducing increased abstraction to the data, its symbolization, or both.

CV-17 - Spatiotemporal Representation

Space and time are integral components of geographic information. There are many ways in which to conceptualize space and time in the geographic realm that stem from time geography research in the 1960s. Cartographers and geovisualization experts alike have grappled with how to represent spatiotemporal data visually. Four broad types of mapping techniques allow for a variety of representations of spatiotemporal data: (1) single static maps, (2) multiple static maps, (3) single dynamic maps, and (4) multiple dynamic maps. The advantages and limitations of these static and dynamic methods are discussed in this entry. For cartographers, identifying the audience and purpose, medium, available data, and available time to design the map are vital aspects to deciding between the different spatiotemporal mapping techniques. However, each of these different mapping techniques offers its own advantages and disadvantages to the cartographer and the map reader. This entry focuses on the mapping of time and spatiotemporal data, the types of time, current methods of mapping, and the advantages and limitations of representing spatiotemporal data.

CV-05 - Statistical Mapping (Enumeration, Normalization, Classification)

Proper communication of spatial distributions, trends, and patterns in data is an important component of a cartographers work. Geospatial data is often large and complex, and due to inherent limitations of size, scalability, and sensitivity, cartographers are often required to work with data that is abstracted, aggregated, or simplified from its original form. Working with data in this manner serves to clarify cartographic messages, expedite design decisions, and assist in developing narratives, but it also introduces a degree of abstraction and subjectivity in the map that can make it easy to infer false messages from the data and ultimately can mislead map readers. This entry introduces the core topics of statistical mapping around cartography. First, we define enumeration and the aggregation of data to units of enumeration. Next, we introduce the importance of data normalization (or standardization) to more truthfully communicate cartographically and, lastly, discuss common methods of data classification and how cartographers bin data into groups that simplify communication.

CV-08 - Symbolization and the Visual Variables

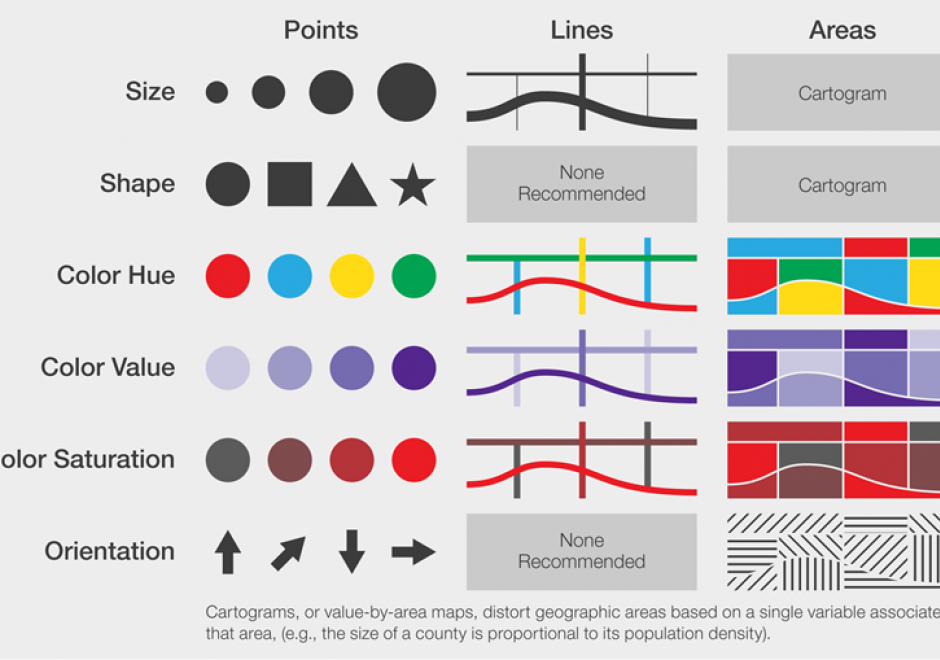
Maps communicate information about the world by using symbols to represent specific ideas or concepts. The relationship between a map symbol and the information that symbol represents must be clear and easily interpreted. The symbol design process requires first an understanding of the underlying nature of the data to be mapped (e.g., its spatial dimensions and level of measurement), then the selection of symbols that suggest those data attributes. Cartographers developed the visual variable system, a graphic vocabulary, to express these relationships on maps. Map readers respond to the visual variable system in predictable ways, enabling mapmakers to design map symbols for most types of information with a high degree of reliability.

Pages