CV-34 - Map Icon Design
The use of map icons is an efficient way to condense a map object into a concise expression of geospatial data. Like all cartographic design, map icon design merges artistic and scientific elements into symbolic representations intended to be readily legible to map readers. This entry reviews the types of map icons and elements of icon design, including the ways in which the visual variables are used in map icon communication. As communicative devices, icons are imbued with cultural meanings and can oftentimes lead to the preservation of stereotypes. This review concludes with an examination of icons’ perpetuation of – and challenge to – cultural stereotypes.


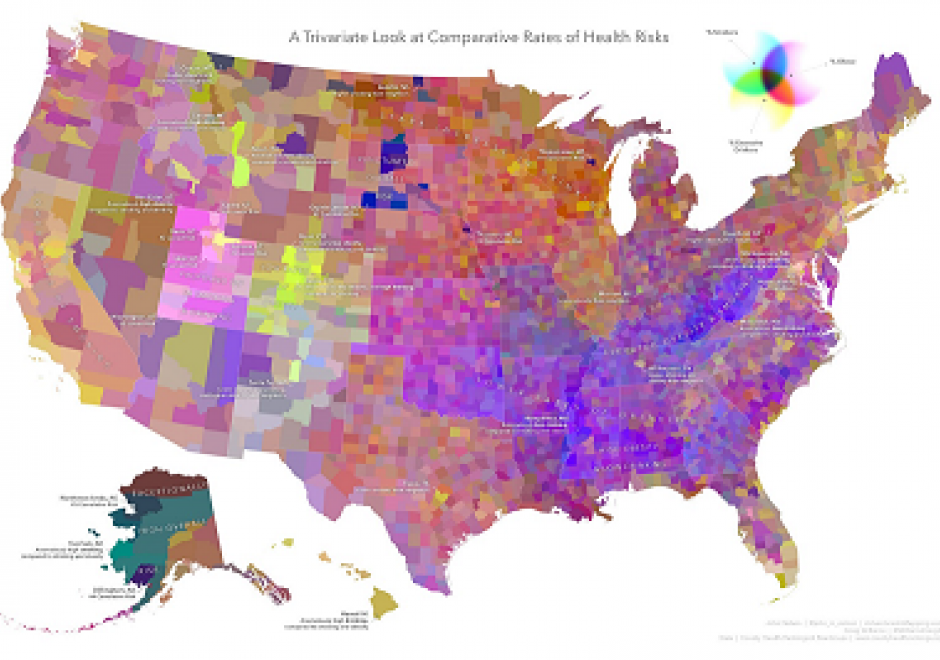
CV-36 - Geovisual Analytics
Geovisual analytics refers to the science of analytical reasoning with spatial information as facilitated by interactive visual interfaces. It is distinguished by its focus on novel approaches to analysis rather than novel approaches to visualization or computational methods alone. As a result, geovisual analytics is usually grounded in real-world problem solving contexts. Research in geovisual analytics may focus on the development of new computational approaches to identify or predict patterns, new visual interfaces to geographic data, or new insights into the cognitive and perceptual processes that users apply to solve complex analytical problems. Systems for geovisual analytics typically feature a high-degree of user-driven interactivity and multiple visual representation types for spatial data. Geovisual analytics tools have been developed for a variety of problem scenarios, such as crisis management and disease epidemiology. Looking ahead, the emergence of new spatial data sources and display formats is expected to spur an expanding set of research and application needs for the foreseeable future.