All Topics

A B C D E F G H I J K L M N O P R S T U V W
DM-52 - Horizontal (Geometric) Datums

A horizontal (geometric) datum provides accurate coordinates (e.g., latitude and longitude) for points on Earth’s surface. Historically, surveyors developed a datum using optically sighted instruments to manually place intervisible survey marks in the ground. This survey work incorporated geometric principles of baselines, distances, and azimuths through the process of triangulation to attach a coordinate value to each survey mark. Triangulation produced a geodetic network of interconnected survey marks that realized the datum (i.e., connecting the geometry of the network to Earth’s physical surface). For local surveys, these datums provided reasonable positional accuracies on the order of meters. Importantly, once placed in the ground, these survey marks were passive; a new survey was needed to determine any positional changes (e.g., due to plate motion) and to update the attached coordinate values. Starting in the 1950s, due to the implementation of active control, space-based satellite geodesy changed how geodetic networks were realized. Here, "active" implies that a survey mark’s coordinates are updated in near real-time through, for example, artificial satellites such as GNSS. Increasingly, GNSS and satellite geodesy is paving the way for a modernized geometric datum that is global in scope and capable of providing positional accuracies at the millimeter level.

DM-90 - Hydrographic Geospatial Data Standards
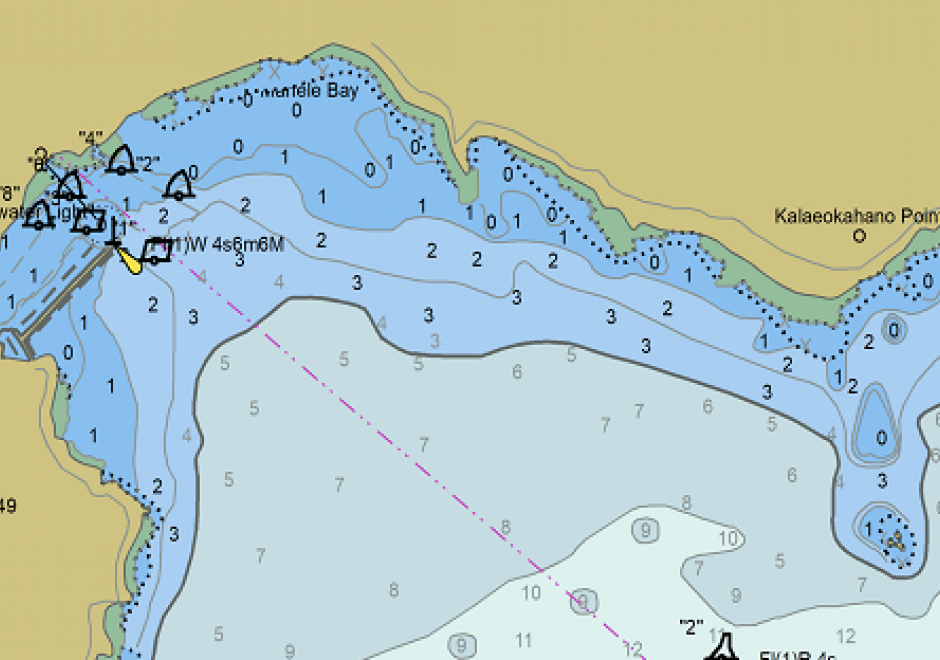
Coastal nations, through their dedicated Hydrographic Offices (HOs), have the obligation to provide nautical charts for the waters of national jurisdiction in support of safe maritime navigation. Accurate and reliable charts are essential to seafarers whether for commerce, defense, fishing, or recreation. Since navigation can be an international activity, mariners often use charts published from different national HOs. Standardization of data collection and processing, chart feature generalization methods, text, symbology, and output validation becomes essential in providing mariners with consistent and uniform products regardless of the region or the producing nation. Besides navigation, nautical charts contain information about the seabed and the coastal environment useful in other domains such as dredging, oceanography, geology, coastal modelling, defense, and coastal zone management. The standardization of hydrographic and nautical charting activities is achieved through various publications issued by the International Hydrographic Organization (IHO). This chapter discusses the purpose and importance of nautical charts, the establishment and role of the IHO in coordinating HOs globally, the existing hydrographic geospatial data standards, as well as those under development based on the new S-100 Universal Hydrographic Data Model.

AM-17 - Intervisibility, Line-of-Sight, and Viewsheds

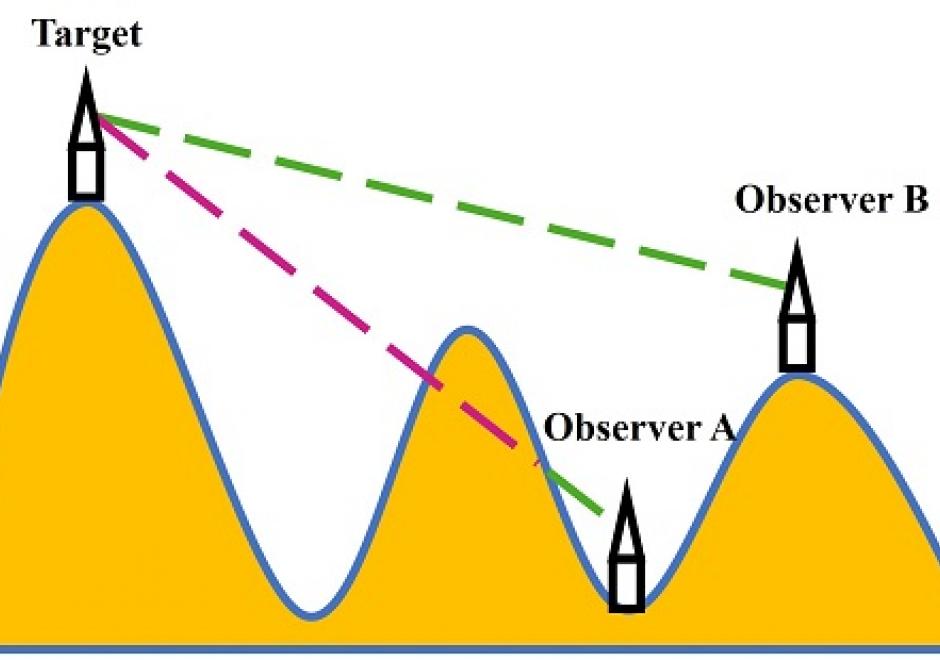
The visibility of a place refers to whether it can be seen by observers from one or multiple other locations. Modeling the visibility of points has various applications in GIS, such as placement of observation points, military observation, line-of-sight communication, optimal path route planning, and urban design. This chapter provides a brief introduction to visibility analysis, including an overview of basic conceptions in visibility analysis, the methods for computing intervisibility using discrete and continuous approaches based on DEM and TINs, the process of intervisibility analysis, viewshed and reverse viewshed analysis. Several practical applications involving visibility analysis are illustrated for geographical problem-solving. Finally, existing software and toolboxes for visibility analysis are introduced.

PD-32 - JavaScript for GIS

JavaScript (which has no connection to the Java computer language) is a popular high-level programming languages used to develop user interfaces in web pages. The principle goal of using JavaScript for programming web and mobile GIS applications is to build front-end applications that make use of spatial data and GIS principles, and in many cases, have embedded, interactive maps. It is considered much easier to program than Java or C languages for adding automation, animation, and interactivity into web pages and applications. JavaScript uses the leading browsers as runtime environments (RTE) and thus benefits from rapid and continuously evolving browser support for all web and mobile applications.

AM-08 - Kernels and Density Estimation

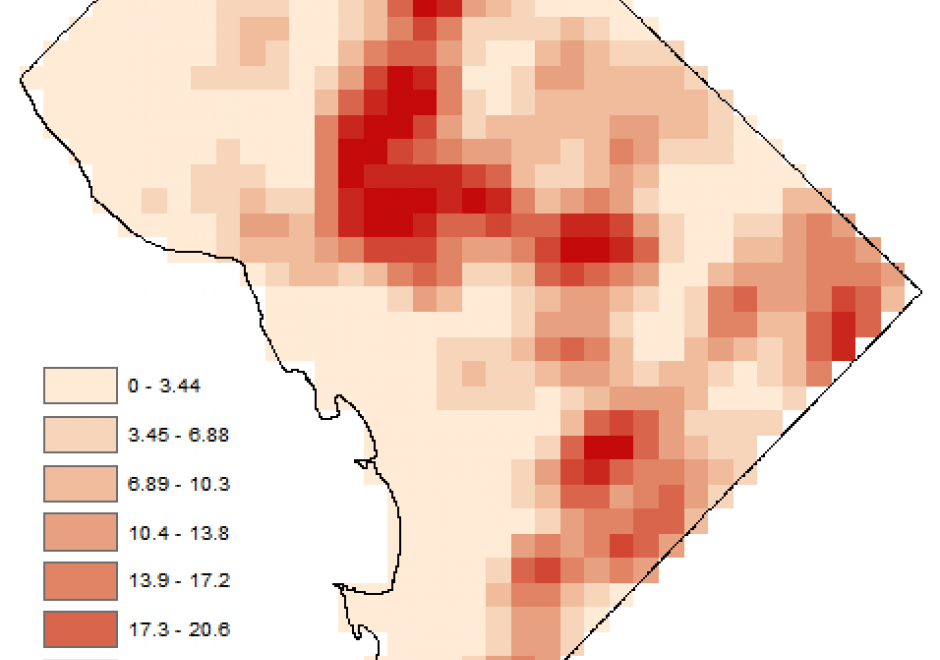
Kernel density estimation is an important nonparametric technique to estimate density from point-based or line-based data. It has been widely used for various purposes, such as point or line data smoothing, risk mapping, and hot spot detection. It applies a kernel function on each observation (point or line) and spreads the observation over the kernel window. The kernel density estimate at a location will be the sum of the fractions of all observations at that location. In a GIS environment, kernel density estimation usually results in a density surface where each cell is rendered based on the kernel density estimated at the cell center. The result of kernel density estimation could vary substantially depending on the choice of kernel function or kernel bandwidth, with the latter having a greater impact. When applying a fixed kernel bandwidth over all of the observations, undersmoothing of density may occur in areas with only sparse observation while oversmoothing may be found in other areas. To solve this issue, adaptive or variable bandwidth approaches have been suggested.

AM-29 - Kriging Interpolation

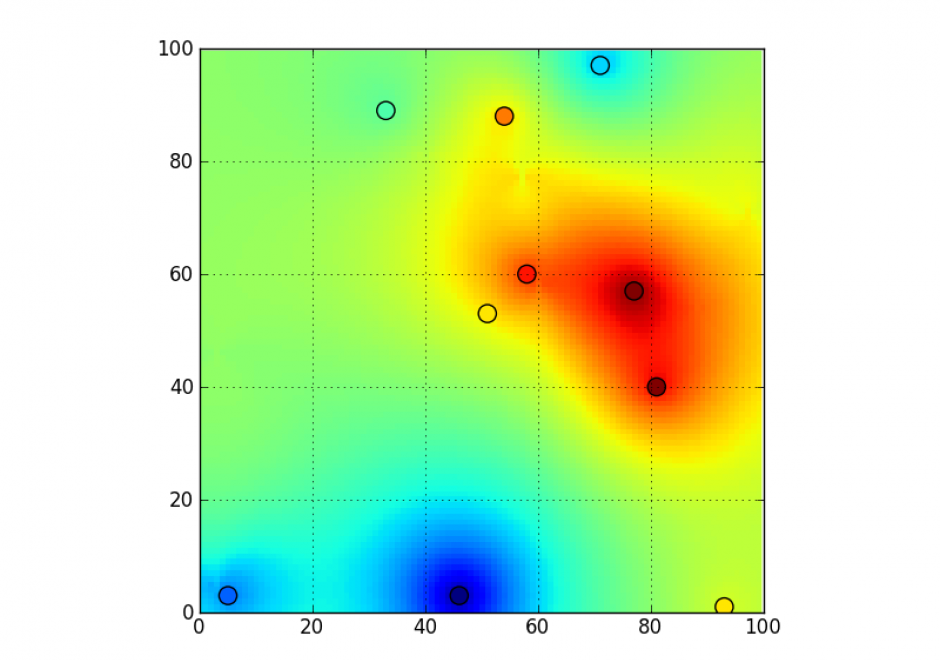
Kriging is an interpolation method that makes predictions at unsampled locations using a linear combination of observations at nearby sampled locations. The influence of each observation on the kriging prediction is based on several factors: 1) its geographical proximity to the unsampled location, 2) the spatial arrangement of all observations (i.e., data configuration, such as clustering of observations in oversampled areas), and 3) the pattern of spatial correlation of the data. The development of kriging models is meaningful only when data are spatially correlated.. Kriging has several advantages over traditional interpolation techniques, such as inverse distance weighting or nearest neighbor: 1) it provides a measure of uncertainty attached to the results (i.e., kriging variance); 2) it accounts for direction-dependent relationships (i.e., spatial anisotropy); 3) weights are assigned to observations based on the spatial correlation of data instead of assumptions made by the analyst for IDW; 4) kriging predictions are not constrained to the range of observations used for interpolation, and 5) data measured over different spatial supports can be combined and change of support, such as downscaling or upscaling, can be conducted.

DC-32 - Landsat

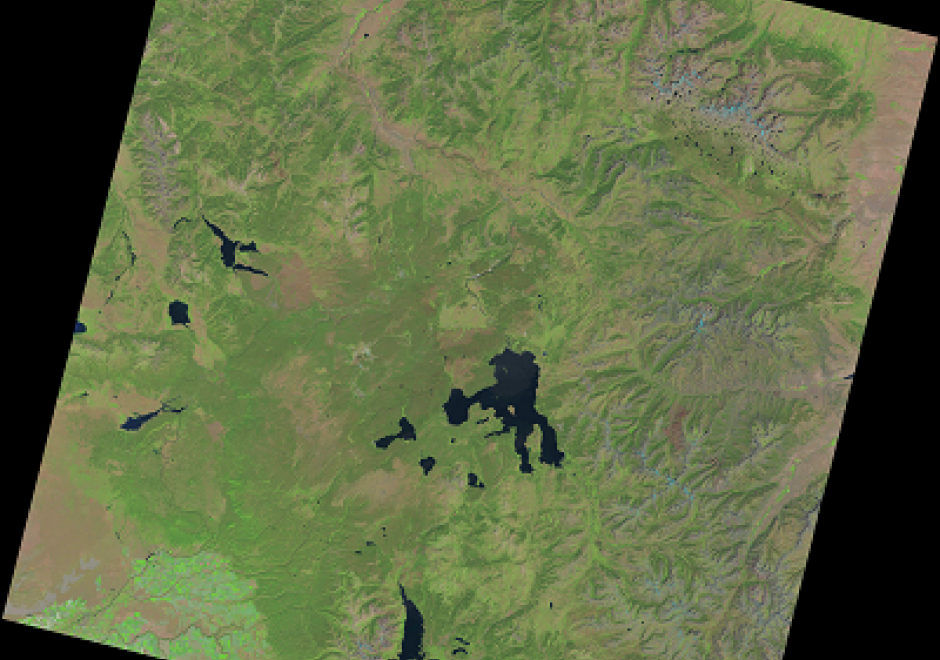
The Landsat series of satellites have collected the longest and continuous earth observation data. Earth surface data collected since 1972 are providing invaluable data for managing natural resources, monitoring changes, and disaster response. After the US Geological Survey (USGS) opened the entire archive to users, the number of monitoring and mapping applications have increased several folds. Currently, Landsat data can be obtained from the USGS and other private entities. The sensors onboard these Landsat satellites have improved over time resulting in changes to the spatial, spectral, radiometric, and temporal resolutions of the images they have collected. Data recorded by the sensors in the form of pixels can be converted to reflectance values. Recently, USGS has reprocessed the entire Landsat data archive and is releasing them as collections. This section provides an overview of the Landsat program and remotely sensed data characteristics, followed by the description of various sensors onboard and data collected by the past and current sensors.

AM-54 - Landscape Metrics

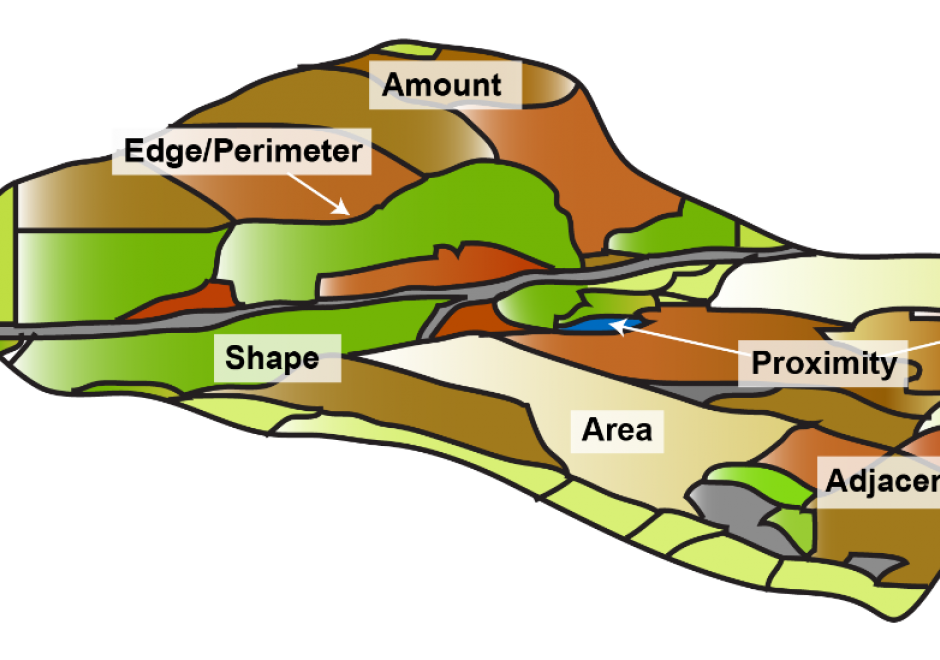
Landscape metrics are algorithms that quantify the spatial structure of patterns – primarily composition and configuration - within a geographic area. The term "landscape metrics" has historically referred to indices for categorical land cover maps, but with emerging datasets, tools, and software programs, the field is growing to include other types of landscape pattern analyses such as graph-based metrics, surface metrics, and three-dimensional metrics. The choice of which metrics to use requires careful consideration by the analyst, taking into account the data and application. Selecting the best metric for the problem at hand is not a trivial task given the large numbers of metrics that have been developed and software programs to implement them.

CV-28 - Lesson Design in Cartography Education

This entry describes six general variables of lesson design in cartography education and offers some practical advice for the development of materials for teaching cartography. First, a lesson’s scope concerns the set of ideas included in a lesson and helps identify different types of lessons based on the kinds of knowledge that they contain. Second, learning objectives concern the things that students should be able to do following a lesson and relate to different cognitive processes of learning. Third, a lesson’s scheme deals with the organizational framework for delivering content. Fourth, a lesson’s guidance concerns the amount and quality of supportive information provided. Fifth, a lesson’s sequence may involve one or more strategies for ordering content. Sixth, a lesson’s activity concerns what students do during a lesson and is often associated with different learning outcomes. These six variables help differentiate traditions for teaching cartography, elucidate some of the recurring challenges in cartography education, and offer strategies for designing lessons to foster meaningful learning outcomes.

DC-27 - Light Detection and Ranging (LiDAR)

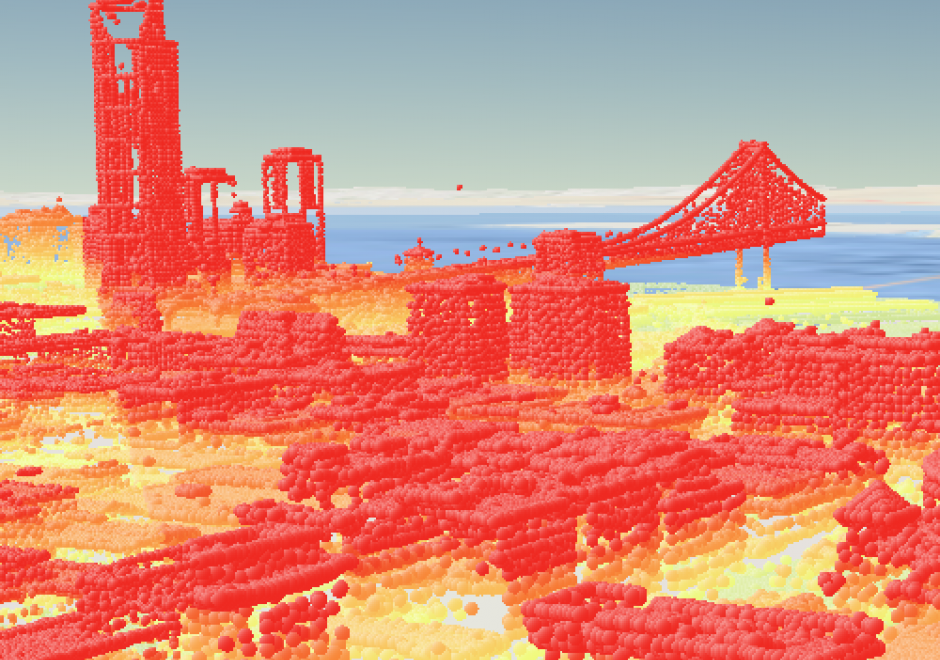
LiDAR (Light Detection and Ranging) is a remote sensing technology that collects information reflected or refracted from the Earth’s surface. The instrumentation that collects LiDAR data can be housed on drones, airplanes, helicopters, or satellites, and consists of a laser scanner that transmits pulses of light. These transmitted pulses reflect or refract from objects on the Earth’s surface or from the surface itself, and the time delay is recorded. Knowing the travel time and the speed of light, an elevation of each pulse above the surface can be determined. From the pulse data collected, the user can determine the topography and landscape features of the Earth or whatever surface has received the pulses. The evolution of software that displays and analyzes LiDAR data and the development of new and more compact file formats have allowed the use of LiDAR to grow dramatically in recent years.

Pages