All Topics

A B C D E F G H I J K L M N O P R S T U V W
FC-26 - Problems of Scale and Zoning

Spatial data are often encoded within a set of spatial units that exhaustively partition a region, where individual level data are aggregated, or continuous data are summarized, over a set of spatial units. Such is the case with census data aggregated to enumeration units for public dissemination. Partitioning schemes can vary by scale, where one partitioning scheme spatially nests within another, or by zoning, where two partitioning schemes have the same number of units but the unit shapes and boundaries differ. The Modifiable Areal Unit Problem (MAUP) refers to the fact the nature of spatial partitioning can affect the interpretation and results of visualization and statistical analysis. Generally, coarser scales of data aggregation tend to have stronger observed statistical associations among variables. The ecological fallacy refers to the assumption that an individual has the same attributes as the aggregate group to which it belongs. Combining spatial data with different partitioning schemes to facilitate analysis is often problematic. Areal interpolation may be used to estimate data over small areas or ecological inference may be used to infer individual behaviors from aggregate data. Researchers may also perform analyses at multiple scales as a point of comparison.

GS-11 - Professional and Practical Ethics of GIS&T
Geospatial technologies are often and rightly described as “powerful.” With power comes the ability to cause harm – intentionally or unintentionally - as well as to do good. In the context of GIS&T, Practical Ethics is the set of knowledge, skills and abilities needed to make reasoned decisions in light of the risks posed by geospatial technologies and methods in a wide variety of use cases. Ethics have been considered from different viewpoints in the GIS&T field. A practitioner's perspective may be based on a combination of "ordinary morality," institutional ethics policies, and professional ethics codes. By contrast, an academic scholar's perspective may be grounded in social or critical theory. What these perspectives have in common is reliance on reason to respond with integrity to ethical challenges. This entry focuses on the special obligations of GIS professionals, and on a method that educators can use to help students develop moral reasoning skills that GIS professionals need. The important related issues of Critical GIS and Spatial Law and Policy are to be considered elsewhere.  

KE-31 - Professional Certification

Professional Certification has been a part of the GIS enterprise for over two decades. There are several different certification programs and related activities now in operation within GIS, though there has been much debate over its merits, how it should be done and by whom. 

DC-01 - Professional Land Surveying

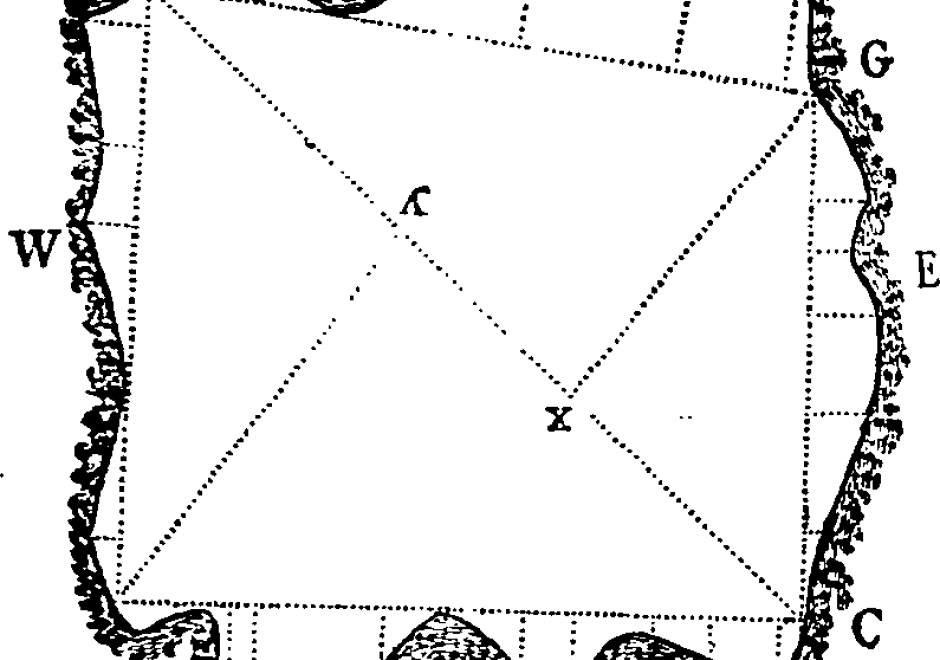
Professional Land Surveyors are the only profession that create the legal description of land parcels, which are then officially recorded to show ownership and rights pertaining to each and every land parcel within a jurisdiction. The Surveyor is skilled at undertaking the physical measurements that are needed to locate accurately land parcels on the ground and to write the unambiguous legal description of the land to create legal title in real estate. These land ownership records are critical for the transfer of ownership in the real estate market. The legal land description provided by Surveyors forms the foundation, and the real estate market provides the mechanism, for real estate to become the largest store of tangible wealth in any free market economy.

PD-29 - Programming of Mobile GIS Applications

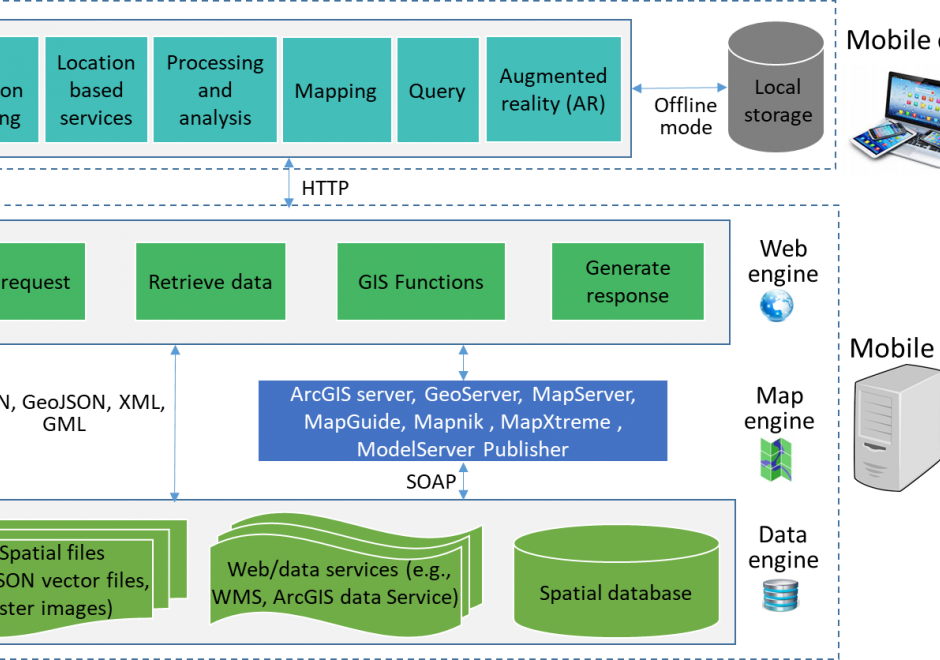
Mobile technology has significantly changed how we communicate and interact with the outside world. With the increasing use of mobile devices and advancement of information communication information (ICT) technologies, mobile GIS emerged to provide real-time data collection and update, and made GIS easier and convenient to access. This entry introduces the concept, types, and general architecture of mobile GIS, key technologies used for mobile GIS development, and examples of mobile GIS applications.

FC-17 - Proximity and Distance Decay

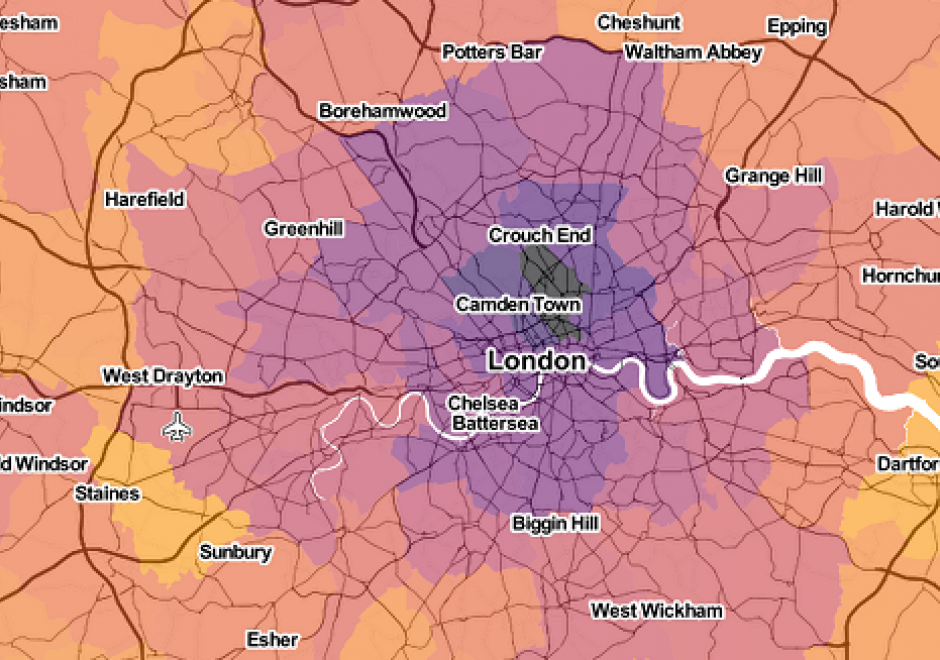
Distance decay is an essential concept in geography. At its core, distance decay describes how the relationship between two entities generally gets weaker as the separation between them increases. Inspired by long-standing ideas in physics, the concept of distance decay is used by geographers to analyze two kinds of relationships. First, the term expresses how measured interactions (such as trade volume or migration flow) generally decrease as the separation between entities increases, as is analyzed by spatial interaction models. Second, the term is used to describe how the implicit similarity between observations changes with separation, as measured by variograms. For either type of relationship, we discuss how "separation" must be clearly articulated according to the mechanism of the relationship under study. In doing this, we suggest that separation need not refer to positions in space or time, but can involve social or behavioral perceptions of separation, too. To close, we present how the "death of distance" is transforming distance decay in uneven ways.

PD-31 - PySAL and Spatial Statistics Libraries

As spatial statistics are essential to the geographical inquiry, accessible and flexible software offering relevant functionalities is highly desired. Python Spatial Analysis Library (PySAL) represents an endeavor towards this end. It is an open-source python library and ecosystem hosting a wide array of spatial statistical and visualization methods. Since its first public release in 2010, PySAL has been applied to address various research questions, used as teaching materials for pedagogical purposes in regular classes and conference workshops serving a wide audience, and integrated into general GIS software such as ArcGIS and QGIS. This entry first gives an overview of the history and new development with PySAL. This is followed by a discussion of PySAL’s new hierarchical structure, and two different modes of accessing PySAL’s functionalities to perform various spatial statistical tasks, including exploratory spatial data analysis, spatial regression, and geovisualization. Next, a discussion is provided on how to find and utilize useful materials for studying and using spatial statistical functions from PySAL and how to get involved with the PySAL community as a user and prospective developer. The entry ends with a brief discussion of future development with PySAL.

PD-11 - Python for GIS

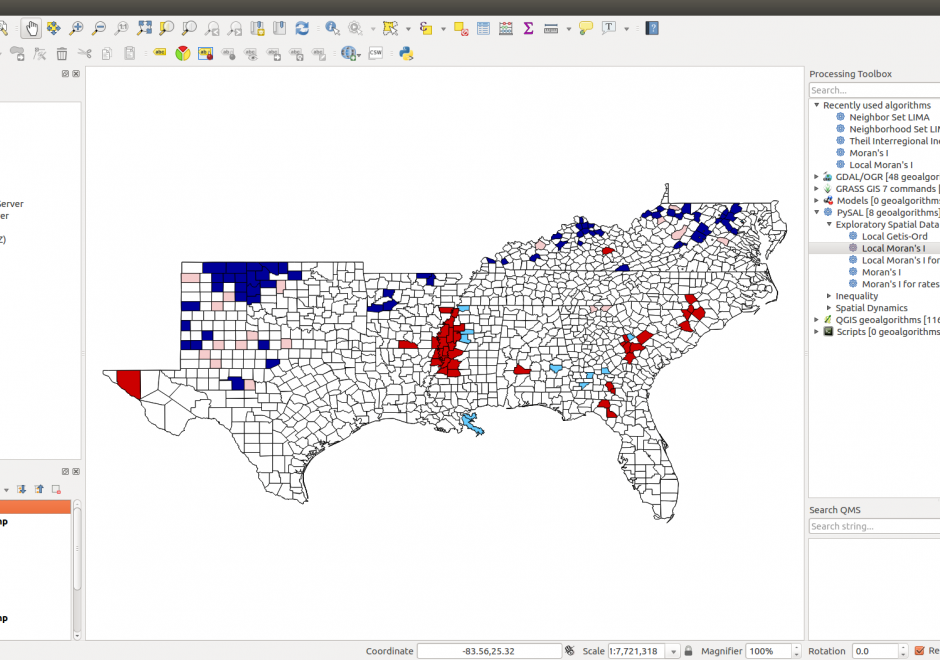
Figure 1. PySAL within QGIS Processing Toolbox: Hot-spot analysis of Homicide Rates in Southern US Counties.


Python is a popular language for geospatial programming and application development. This entry provides an overview of the different development modes that can be adopted for GIS programming with Python and discusses the history of Python adoption in the GIS community. The different layers of the geospatial development stack in Python are examined giving the reader an understanding of the breadth that Python offers to the GIS developer. Future developments and broader issues related to interoperability and programming ecosystems are identified.

PD-15 - R for Geospatial Analysis and Mapping

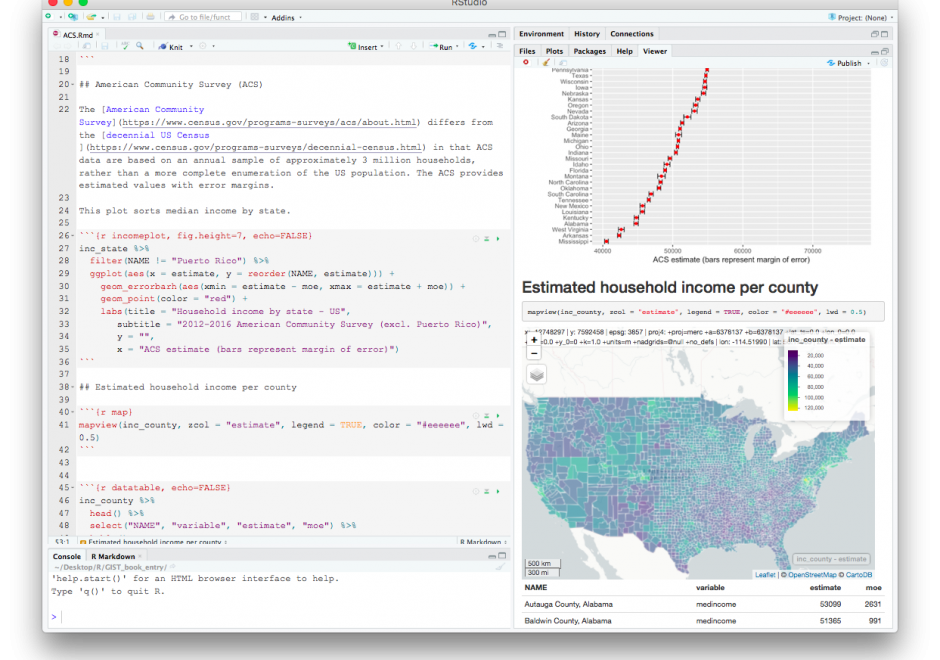
R is a programming language as well as a computing environment to perform a wide variety of data analysis, statistics, and visualization. One of the reasons for the popularity of R is that it embraces open, transparent scholarship and reproducible research. It is possible to combine content and code in one document, so data, analysis, and graphs are tied together into one narrative, which can be shared with others to recreate analyses and reevaluate interpretations. Different from tools like ArcGIS or QGIS that are specifically built for spatial data, GIS functionality is just one of many things R offers. And while users of dedicated GIS tools typically interact with the software via a point-and-click graphical interface, R requires command-line scripting. Many R users today rely on RStudio, an integrated development environment (IDE) that facilitates the writing of R code and comes with a series of convenient features, like integrated help, data viewer, code completion, and syntax coloring. By using R Markdown, a particular flavor of the Markdown language, RStudio also makes it particularly easy to create documents that embed and execute R code snippets within a text and to render both, static documents (like PDF), as well as interactive html pages, a feature particularly useful for exploratory GIS work and mapping.

CV-20 - Raster Formats and Sources

Raster data is commonly used by cartographers in concert with vector data. Choice of raster file format is important when using raster data or producing raster output from vector data. Raster formats are designed for specific purposes and have limitations in color representation and data loss. The simplest raster formats are just a single two-dimensional array of pixels, where multi-band raster datasets use additional data values to represent color or other data. The article covers considerations for the intended use of raster formats. Formats and resolutions appropriate for the web may not be appropriate for print or higher resolution devices. Several types of raster sources are available including single band measures, imagery, and existing raster maps or basemaps. The future of raster will evolve as more formats, sources, and computational improvements are made.

Pages