All Topics

The Cartography & Visualization section encapsulates competencies related to the design and use of maps and mapping technology. This section covers core topics of reference and thematic maps design, as well as the emerging topics of interaction design, web map design, and mobile map design. This section also covers historical and contemporary influences on cartography and evolving data and critical considerations for map design and use.  

Topics in this Knowledge Area are listed thematically below. Existing topics are in regular font and linked directly to their original entries (published in 2006; these contain only Learning Objectives). Entries that have been updated and expanded are in bold. Forthcoming, future topics are italicized

History & Trends Map Design Techniques Interactive Design Techniques
Cartography & Science Common Thematic Map Types User Interface and User Experience (UI/UX) Design
Cartography & Art Multivariate Mapping Web Mapping
Cartography & Power Spatio-Temporal Representation Virtual & Immersive Environments
  Representing Uncertainty Big Data Visualization
  Terrain Representation Mobile Maps & Responsive Design
Data Considerations Cartograms Usability Engineering & Evaluation
Vector Formats & Sources Map Icon Design Geovisual Analytics
Raster Formats & Sources Narrative & Storytelling Geovisualization
  Flow Maps  
Map Design Fundamentals  Collaborative Cartography  
Scale & Generalization Map Use  
Statistical Mapping (Enumeration, Normalization, Classification) Lesson Design in Cartography Education  
Map Projections Map Reading  
Visual Hierarchy & Layout Map Interpretation  
Symbolization & the Visual Variables Map Analysis  
Color Theory    
Typography    
Design and Aesthetics    
Map Production and Management    


B C D F G L M N R S T U V W
CV-03 - Vector Formats and Sources

In the last ten years, the rise of efficient computing devices with significant processing power and storage has caused a surge in digital data collection and publication. As more software programs and hardware devices are released, we are not only seeing an increase in available data, but also an increase in available data formats. Cartographers today have access to a wide range of interesting datasets, and online portals for downloading geospatial data now frequently offer that data in several different formats. This chapter provides information useful to modern cartographers working with vector data, including an overview of common vector data formats (e.g. shapefile, GeoJSON, file geodatabase); their relative benefits, idiosyncrasies, and limitations; and a list of popular sources for geospatial vector data (e.g. United States Census Bureau, university data warehouses).

CV-16 - Virtual and Immersive Environments
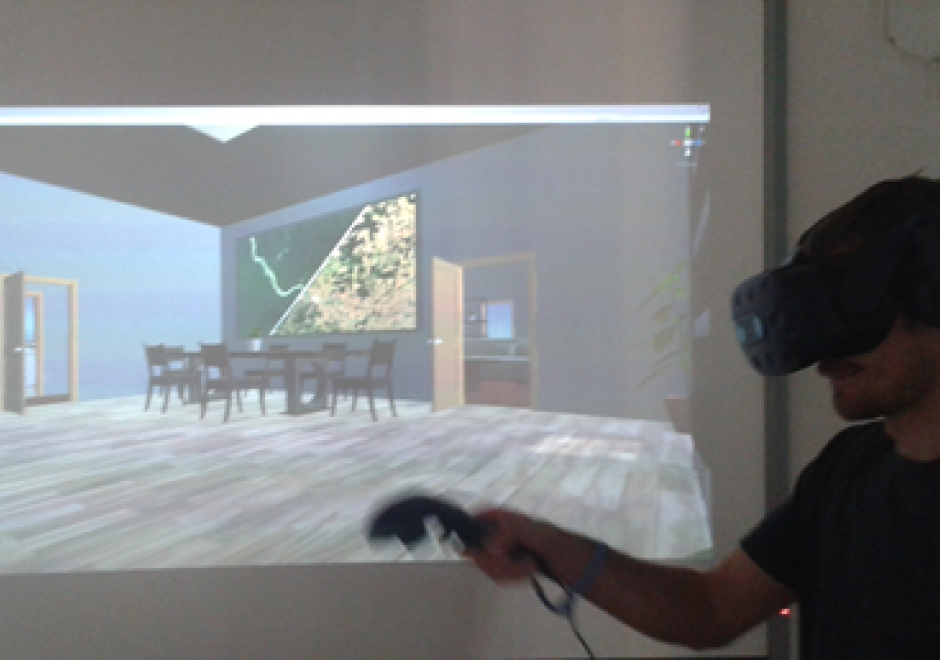
A virtual environment (VE) is a 3D computer-based simulation of a real or imagined environment in which users can navigate and interactive with virtual objects. VEs have found popular use in communicating geographic information for a variety of domain applications. This entry begins with a brief history of virtual and immersive environments and an introduction to a common framework used to describe characteristics of VEs. Four design considerations for VEs then are reviewed: cognitive, methodological, social, and technological. The cognitive dimension involves generating a strong sense of presence for users in a VE, enabling users to perceive and study represented data in both virtual and real environments. The methodological dimension covers methods in collecting, processing, and visualizing data for VEs. The technological dimension surveys different VE hardware devices (input, computing, and output devices) and software tools (desktop and web technologies). Finally, the social dimension captures existing use cases for VEs in geo-related fields, such as geography education, spatial decision support, and crisis management.

CV-07 - Visual Hierarchy and Layout

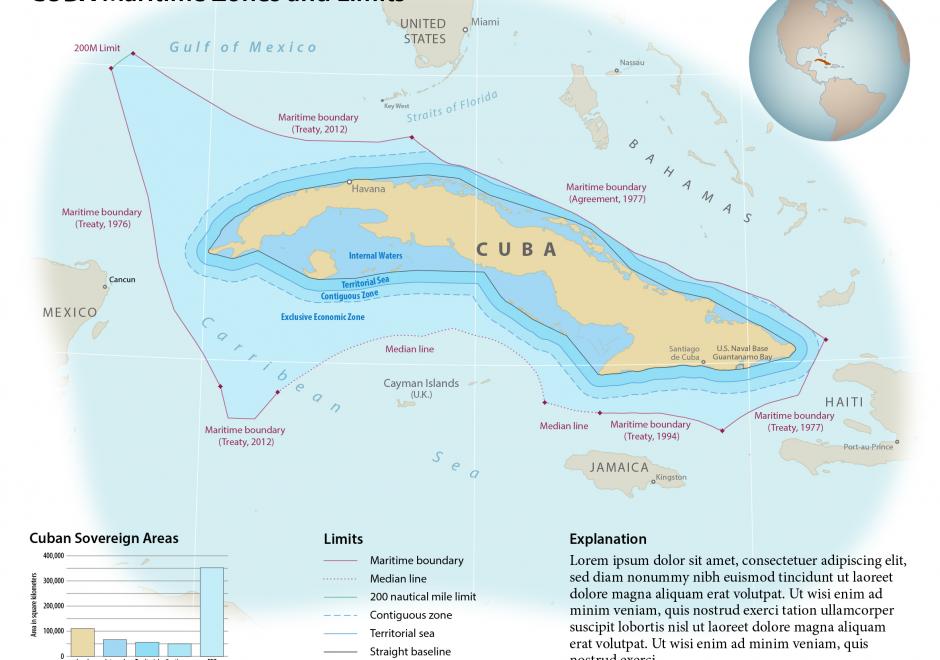
Mapmaking, by digital or manual methods, involves taking complex geographic information and building a visual image with many components. Creating effective maps requires an understanding of how to construct the elements of the map into a coherent whole that executes the communicative purpose of the map. Visual hierarchy and layout are the cartographer’s tools for organizing the map and completing the map construction. The cartographer layers the mapped geography in an image into a visual hierarchy emphasizing some features and de-emphasizing others in vertical ordering of information. Likewise, the cartographer arranges the components of a map image—title, main map, inset map, north arrow, scale, legend, toolbar, etc.—into a layout that guides the reader’s eye around the horizontal plane of the map. The visual hierarchy and layout processes work together to create the structure of the map image.