All Topics

A B C D E F G H I J K L M N O P R S T U V W
AM-44 - Modelling Accessibility

Modelling accessibility involves combining ideas about destinations, distance, time, and impedances to measure the relative difficulty an individual or aggregate region faces when attempting to reach a facility, service, or resource. In its simplest form, modelling accessibility is about quantifying movement opportunity. Crucial to modelling accessibility is the calculation of the distance, time, or cost distance between two (or more) locations, which is an operation that geographic information systems (GIS) have been designed to accomplish. Measures and models of accessibility thus draw heavily on the algorithms embedded in a GIS and represent one of the key applied areas of GIS&T.

AM-13 - Multi-criteria evaluation
  • Describe the implementation of an ordered weighting scheme in a multiple-criteria aggregation
  • Compare and contrast the terms multi-criteria evaluation, weighted linear combination, and site suitability analysis
  • Differentiate between contributing factors and constraints in a multi-criteria application
  • Explain the legacy of multi-criteria evaluation in relation to cartographic modeling
  • Determine which method to use to combine criteria (e.g., linear, multiplication)
  • Create initial weights using the analytical hierarchy process (AHP)
  • Calibrate a linear combination model by adjusting weights using a test data set
KE-34 - Multi-Organizational GIS Coordination

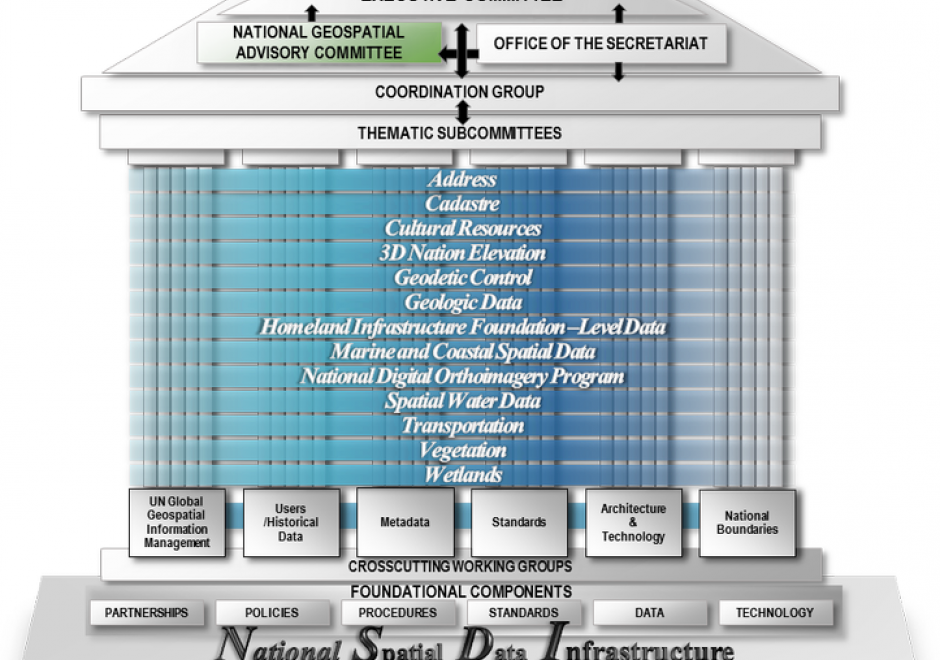
For many years, collaboration has been a key cornerstone in the success of efforts achieved by the geospatial community.  When paired with governance, collaborative efforts often lead to sustainability and have the effect of broadening the benefits that can be achieved.  The following text shares how the geospatial community uses collaboration and governance as tools to achieve benefits across the community.  Case studies are provided to illustrate the process and the outcomes achieved. 

CV-12 - Multivariate Mapping

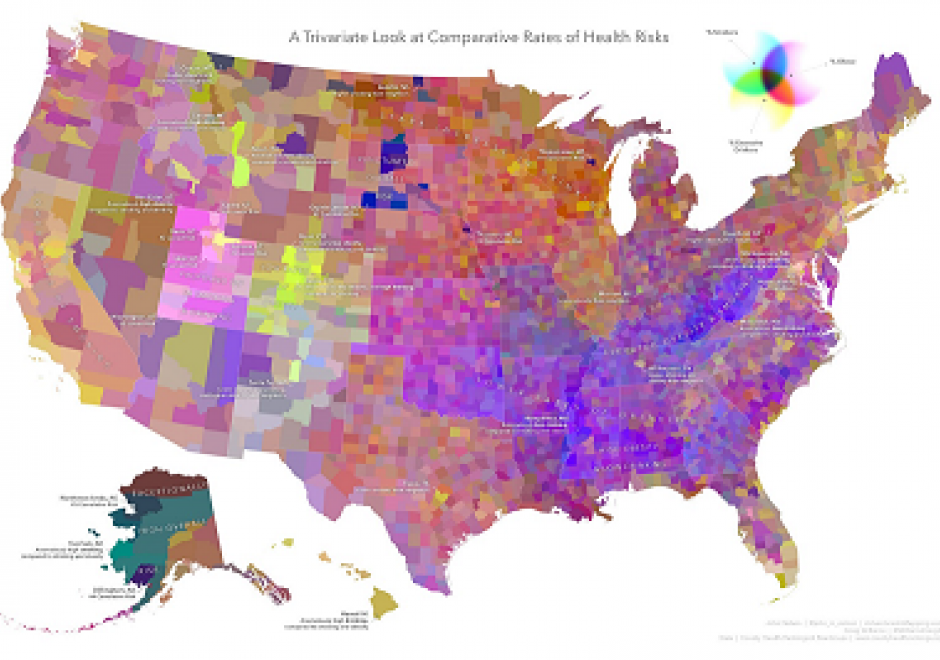
Bivariate and multivariate maps encode two or more data variables concurrently into a single symbolization mechanism. Their purpose is to reveal and communicate relationships between the variables that might not otherwise be apparent via a standard single-variable technique. These maps are inherently more complex, though offer a novel means of visualizing the nuances that may exist between the mapped variables. As information-dense visual products, they can require considerable effort on behalf of the map reader, though a thoughtfully-designed map and legend can be an interesting opportunity to effectively convey a comparative dimension.

This chapter describes some of the key types of bivariate and multivariate maps, walks through some of the rationale for various techniques, and encourages the reader to take an informed, balanced approach to map design weighing information density and visual complexity. Some alternatives to bivariate and multivariate mapping are provided, and their relative merits are discussed.

CV-33 - Narrative and Storytelling

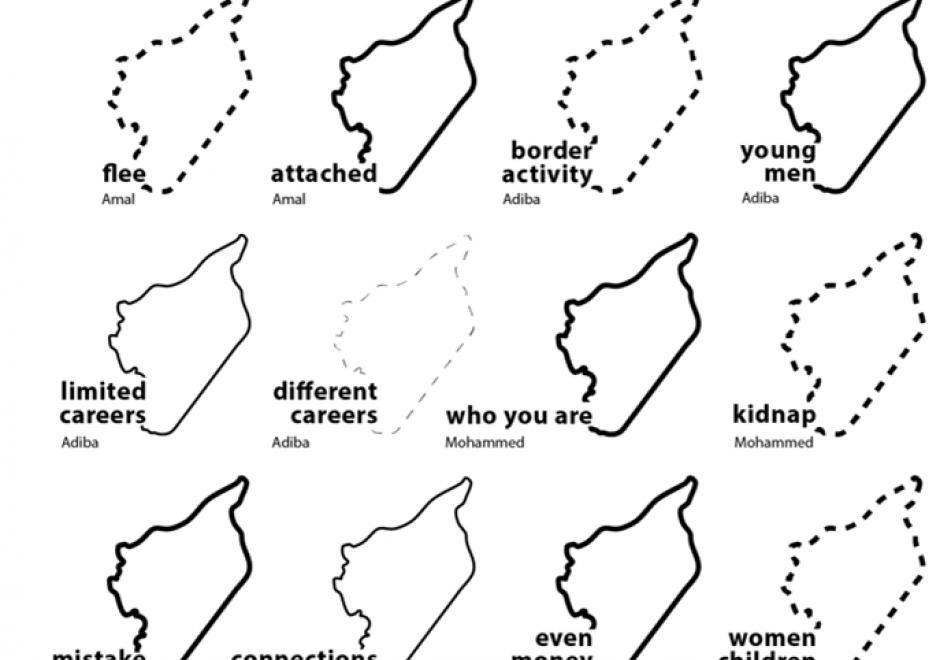
Maps are powerful storytellers. Maps have a long history combining spatial relations with cartographic language to locate, analyze, ground, and express stories told across time and space. Today, “story maps” are increasingly visible in cartography, GIScience, digital humanities, data visualization, and journalism due to the volume of available data and increasingly accessible mapping tools. Perhaps, most importantly, maps present world views and much larger (often hidden) stories or “meta-narratives.” These underlying stories often emerge from dominant perspectives that are deeply informed by power structures like racism, patriarchy, ableism, etc. and further generate uneven geographies. Attention to power in narrative and storytelling reveals and gives voice to alternative storylines and perspectives that can be woven together across time and space. In this entry, I introduce multiple conceptualizations of maps and stories from cartography and data journalism to feminist mapping, Black geographies, and decolonial mapping to illustrate the power of narrative and storytelling in mapping. I argue that understanding the power of narrative and storytelling in mapping is an essential skillset for students and professionals alike.

PD-10 - Natural Language Processing in GIScience Applications

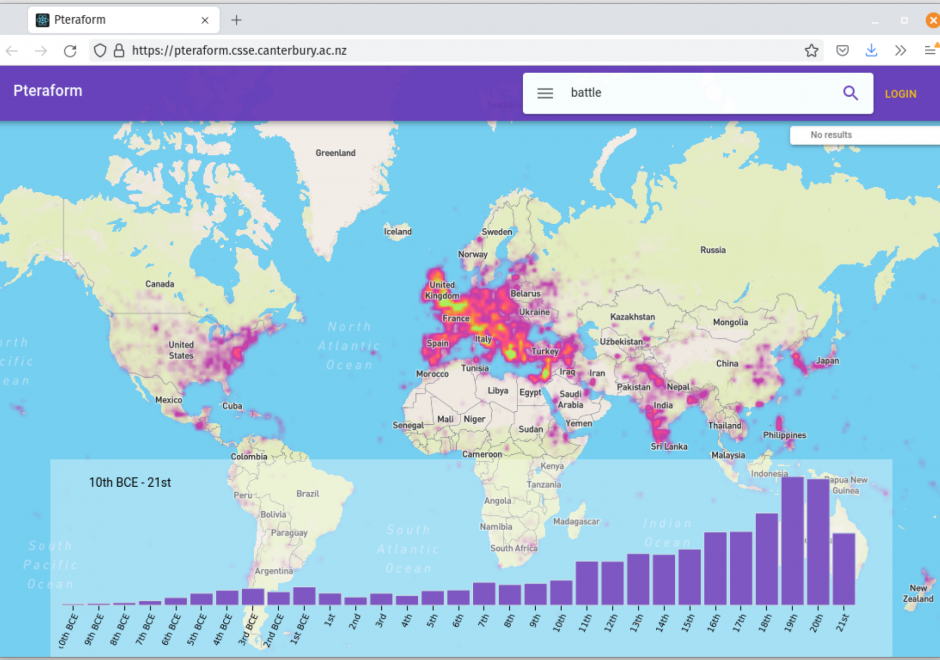
Natural Language Processing (NLP) has experienced explosive growth in recent years. While the field has been around for decades, recent advances in NLP techniques as well as advanced computational resources have re-engaged academics, industry, and the general public. The field of Geographic Information Science has played a small but important role in the growth of this domain. Combining NLP techniques with existing geographic methodologies and knowledge has contributed substantially to many geospatial applications currently in use today. In this entry, we provide an overview of current application areas for natural language processing in GIScience. We provide some examples and discuss some of the challenges in this area.

DC-16 - Nature of Multispectral Image Data

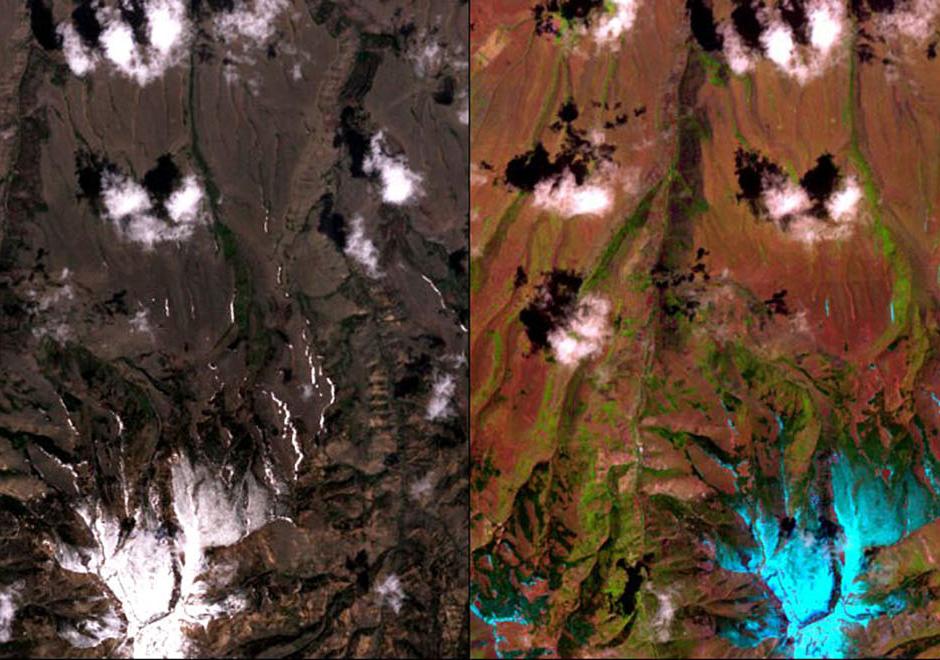
A multispectral image comprises a set of co-registered images, each of which captures the spatially varying brightness of a scene in a specific spectral band, or electromagnetic wavelength region. An image is structured as a raster, or grid, of pixels. Multispectral images are used as a visual backdrop for other GIS layers, to provide information that is manually interpreted from images, or to generate automatically-derived thematic layers, for example through classification. The scale of multispectral images has spatial, spectral, radiometric and temporal components. Each component of scale has two aspects, extent (or coverage), and grain (or resolution). The brightness variations of an image are determined by factors that include (1) illumination variations and effects of the atmosphere, (2) spectral properties of materials in the scene (particularly reflectance, but also, depending on the wavelength, emittance), (3) spectral bands of the sensor, and (4) display options, such as the contrast stretch, which affect the visualization of the image. This topic review focuses primarily on optical remote sensing in the visible, near infrared and shortwave infrared parts of the electromagnetic spectrum, with an emphasis on satellite imagery.  

FC-40 - Neighborhoods

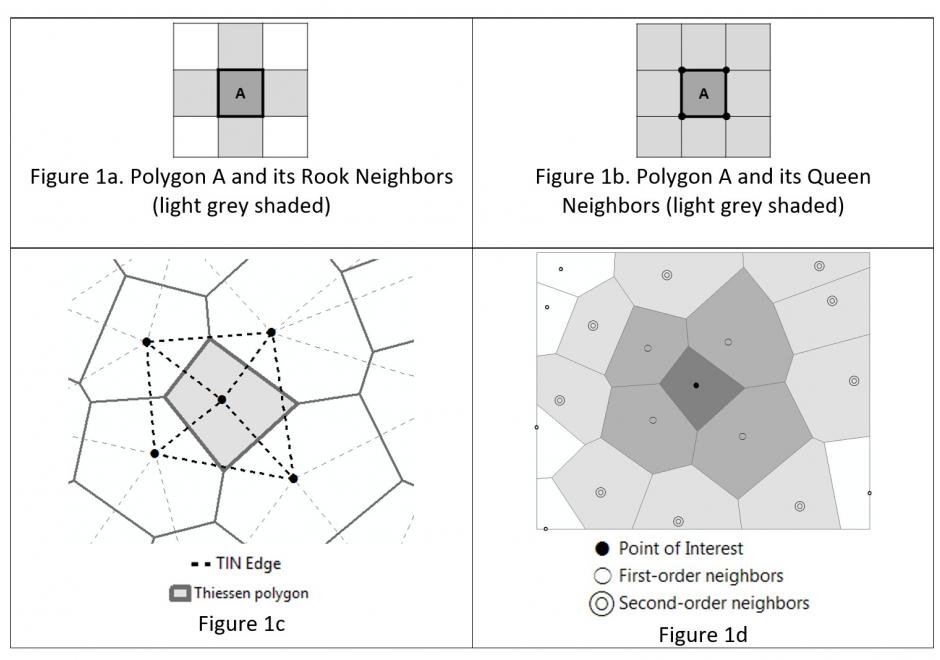
Neighborhoods mean different things in varied contexts like computational geometry, administration and planning, as well as urban geography and other fields. Among the multiple contexts, computational geometry takes the most abstract and data-oriented approach: polygon neighborhoods refer to polygons sharing a boundary or a point, and point neighborhoods are defined by connected Thiessen polygons or other more complicated algorithms. Neighborhoods in some regions can be a practical and clearly delineated administration or planning units. In urban geography and some related social sciences, the terms neighborhood and community have been used interchangeably on many occasions, and neighborhoods can be a fuzzy and general concept with no clear boundaries such that they cannot be easily or consensually defined. Neighborhood effects have a series of unique meanings and several delineation methods are commonly used to define social and environmental effects in health applications.

FC-19 - Networks

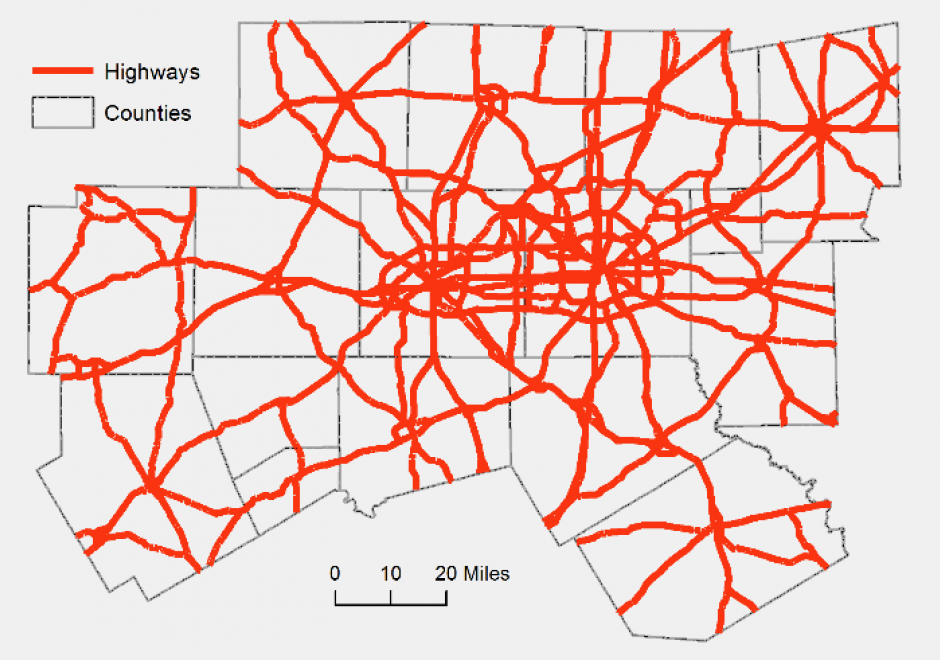
A network is a widely used term with different definitions and methodologies depending on the applications. In GIS, a network refers to an arrangement of elements (i.e., nodes, links) and information on their connections and interactions. There are two types of networks: physical and logical. While a physical network has tangible objects (e.g., road segments), a logical network represents logical connections among nodes and links. A network can be represented with a mathematical notion called graph theory. Different network components are utilized to describe characteristics of a network including loops, walks, paths, circuits, and parallel edges. Network data are commonly organized in a vector format with network topology, specifically connectivity among nodes and links, whereas raster data can be also utilized for a least-cost problem over continuous space. Network data is utilized in a wide range of network analyses, including the classic shortest path problem.

DM-67 - NoSQL Databases

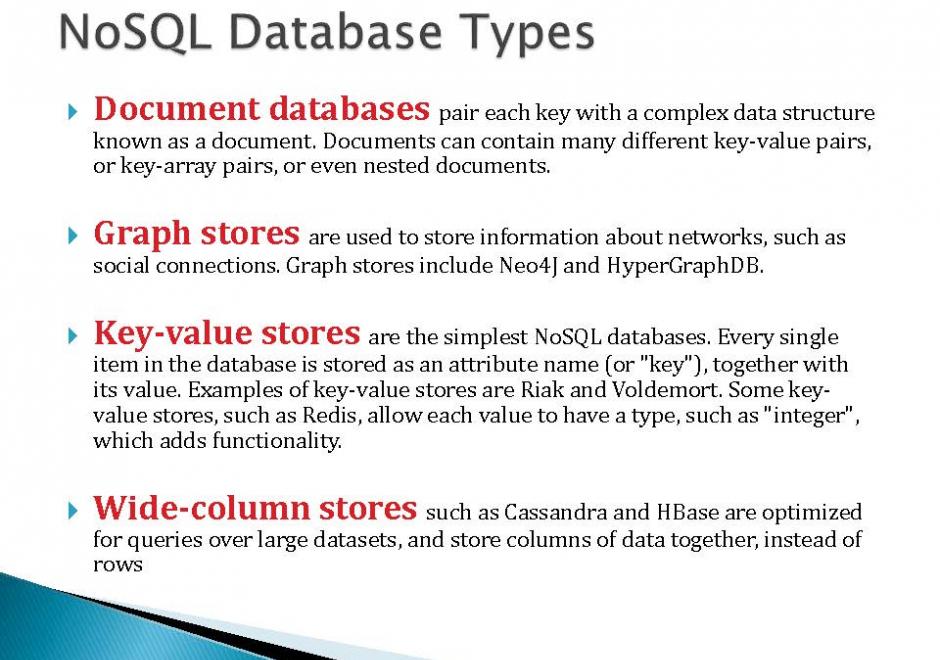
NoSQL databases are open-source, schema-less, horizontally scalable and high-performance databases. These characteristics make them very different from relational databases, the traditional choice for spatial data. The four types of data stores in NoSQL databases (key-value store, document store, column store, and graph store) contribute to significant flexibility for a range of applications. NoSQL databases are well suited to handle typical challenges of big data, including volume, variety, and velocity. For these reasons, they are increasingly adopted by private industries and used in research. They have gained tremendous popularity in the last decade due to their ability to manage unstructured data (e.g. social media data).

Pages