All Topics

The Cartography & Visualization section encapsulates competencies related to the design and use of maps and mapping technology. This section covers core topics of reference and thematic maps design, as well as the emerging topics of interaction design, web map design, and mobile map design. This section also covers historical and contemporary influences on cartography and evolving data and critical considerations for map design and use.  

Topics in this Knowledge Area are listed thematically below. Existing topics are in regular font and linked directly to their original entries (published in 2006; these contain only Learning Objectives). Entries that have been updated and expanded are in bold. Forthcoming, future topics are italicized

History & Trends Map Design Techniques Interactive Design Techniques
Cartography & Science Common Thematic Map Types User Interface and User Experience (UI/UX) Design
Cartography & Art Multivariate Mapping Web Mapping
Cartography & Power Spatio-Temporal Representation Virtual & Immersive Environments
  Representing Uncertainty Big Data Visualization
  Terrain Representation Mobile Maps & Responsive Design
Data Considerations Cartograms Usability Engineering & Evaluation
Vector Formats & Sources Map Icon Design Geovisual Analytics
Raster Formats & Sources Narrative & Storytelling Geovisualization
  Flow Maps  
Map Design Fundamentals  Collaborative Cartography  
Scale & Generalization Map Use  
Statistical Mapping (Enumeration, Normalization, Classification) Lesson Design in Cartography Education  
Map Projections Map Reading  
Visual Hierarchy & Layout Map Interpretation  
Symbolization & the Visual Variables Map Analysis  
Color Theory    
Typography    
Design and Aesthetics    
Map Production and Management    


B C D F G L M N R S T U V W
CV-31 - Flow Maps

Flow mapping is a cartographic method of representing movement of phenomena. Maps of this type often depict the vector movement of entities (imports and exports, people, information) between geographic areas, but the general method also encompasses a range of graphics illustrating networks (e.g., transit and communications grids) and dynamic systems (e.g., wind and water currents). Most flow maps typically use line symbols of varying widths, lengths, shapes, colors, or speeds (in the case of animated flow maps) to show the quality, direction, and magnitude of movements. Aesthetic considerations for flow maps are numerous and their production is often done manually without significant automation. Flow maps frequently use distorted underlying geography to accommodate the placement of flow paths, which are often dramatically smoothed/abstracted into visually pleasing curves or simply straight lines. In the extreme, such maps lack a geographic coordinate space and are more diagrammatic, as in Sankey diagrams, alluvial diagrams, slope graphs, and circle migration plots. Whatever their form, good flow maps should effectively visualize the relative magnitude and direction of movement or potential movement between a one or more origins and destinations.

CV-36 - Geovisual Analytics
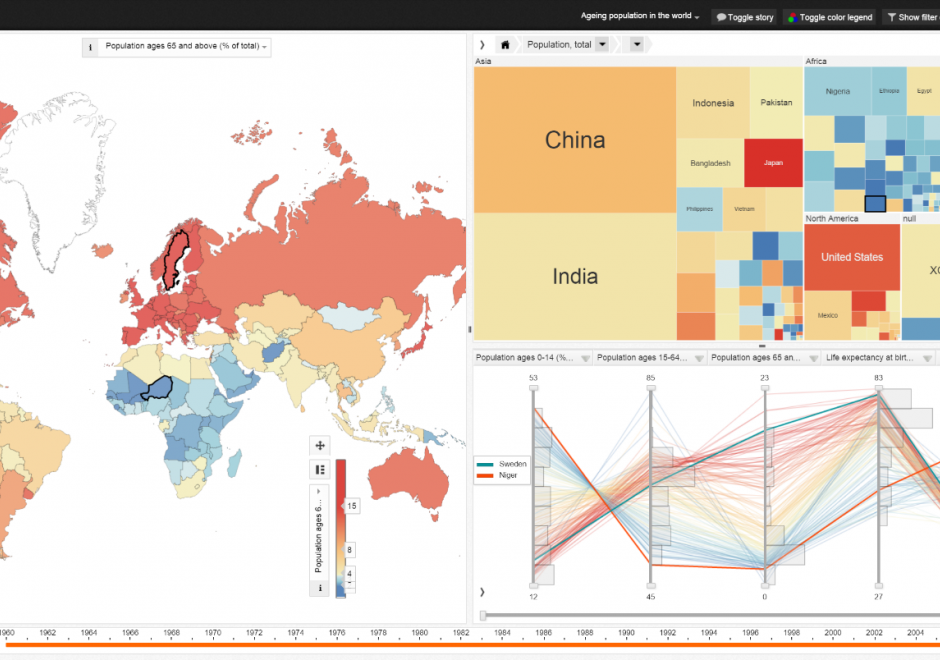
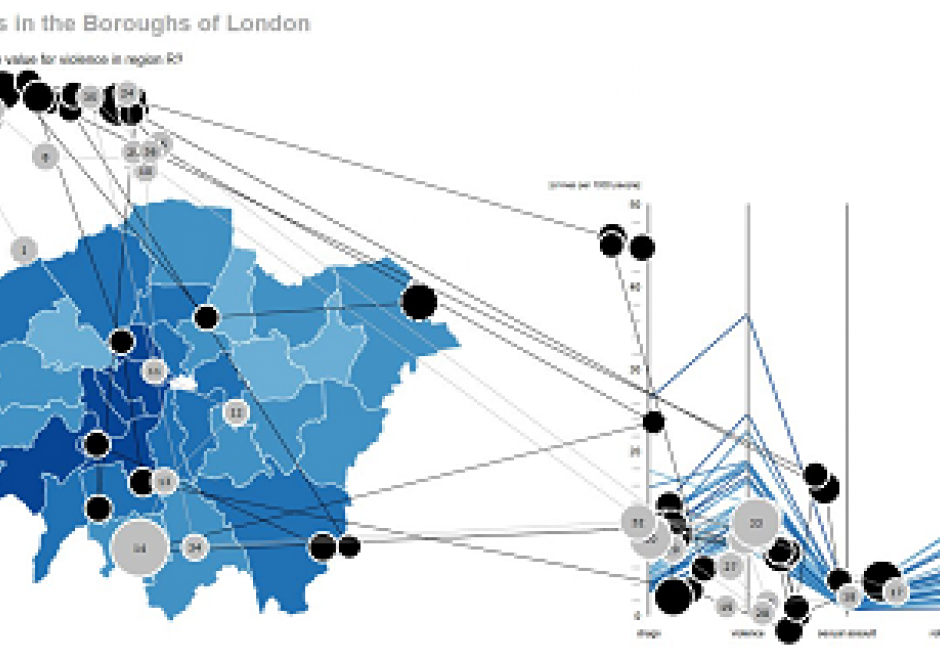
Geovisual analytics refers to the science of analytical reasoning with spatial information as facilitated by interactive visual interfaces. It is distinguished by its focus on novel approaches to analysis rather than novel approaches to visualization or computational methods alone. As a result, geovisual analytics is usually grounded in real-world problem solving contexts. Research in geovisual analytics may focus on the development of new computational approaches to identify or predict patterns, new visual interfaces to geographic data, or new insights into the cognitive and perceptual processes that users apply to solve complex analytical problems. Systems for geovisual analytics typically feature a high-degree of user-driven interactivity and multiple visual representation types for spatial data. Geovisual analytics tools have been developed for a variety of problem scenarios, such as crisis management and disease epidemiology. Looking ahead, the emergence of new spatial data sources and display formats is expected to spur an expanding set of research and application needs for the foreseeable future. 

CV-35 - Geovisualization

Geovisualization is primarily understood as the process of interactively visualizing geographic information in any of the steps in spatial analyses, even though it can also refer to the visual output (e.g., plots, maps, combinations of these), or the associated techniques. Rooted in cartography, geovisualization emerged as a research thrust with the leadership of Alan MacEachren (Pennsylvania State University) and colleagues when interactive maps and digitally-enabled exploratory data analysis led to a paradigm shift in 1980s and 1990s. A core argument for geovisualization is that visual thinking using maps is integral to the scientific process and hypothesis generation, and the role of maps grew beyond communicating the end results of an analysis or documentation process. As such, geovisualization interacts with a number of disciplines including cartography, visual analytics, information visualization, scientific visualization, statistics, computer science, art-and-design, and cognitive science; borrowing from and contributing to each. In this entry, we provide a definition and a brief history of geovisualization including its fundamental concepts, elaborate on its relationship to other disciplines, and briefly review the skills/tools that are relevant in working with geovisualization environments. We finish the entry with a list of learning objectives, instructional questions, and additional resources.

CV-28 - Lesson Design in Cartography Education

This entry describes six general variables of lesson design in cartography education and offers some practical advice for the development of materials for teaching cartography. First, a lesson’s scope concerns the set of ideas included in a lesson and helps identify different types of lessons based on the kinds of knowledge that they contain. Second, learning objectives concern the things that students should be able to do following a lesson and relate to different cognitive processes of learning. Third, a lesson’s scheme deals with the organizational framework for delivering content. Fourth, a lesson’s guidance concerns the amount and quality of supportive information provided. Fifth, a lesson’s sequence may involve one or more strategies for ordering content. Sixth, a lesson’s activity concerns what students do during a lesson and is often associated with different learning outcomes. These six variables help differentiate traditions for teaching cartography, elucidate some of the recurring challenges in cartography education, and offer strategies for designing lessons to foster meaningful learning outcomes.

CV-23 - Map analysis
  • Create a profile of a cross section through a terrain using a topographic map and a digital elevation model (DEM)
  • Measure point-feature movement and point-feature diffusion on maps
  • Describe maps that can be used to find direction, distance, or position, plan routes, calculate area or volume, or describe shape
  • Explain how maps can be used in determining an optimal route or facility selection
  • Explain how maps can be used in terrain analysis (e.g., elevation determination, surface profiles, slope, viewsheds, and gradient)
  • Explain how the types of distortion indicated by projection metadata on a map will affect map measurements
  • Explain the differences between true north, magnetic north, and grid north directional references
  • Compare and contrast the manual measurement of the areas of polygons on a map printed from a GIS with those calculated by the computer and discuss the implications these variations in measurement might have on map use
  • Determine feature counts of point, line, and area features on maps
  • Analyze spatial patterns of selected point, line, and area feature arrangements on maps
  • Calculate slope using a topographic map and a DEM
  • Calculate the planimetric and actual road distances between two locations on a topographic map
  • Plan an orienteering tour of a specific length that traverses slopes of an appropriate steepness and crosses streams in places that can be forded based on a topographic map
  • Describe the differences between azimuths, bearings, and other systems for indicating directions
CV-34 - Map Icon Design

The use of map icons is an efficient way to condense a map object into a concise expression of geospatial data. Like all cartographic design, map icon design merges artistic and scientific elements into symbolic representations intended to be readily legible to map readers. This entry reviews the types of map icons and elements of icon design, including the ways in which the visual variables are used in map icon communication. As communicative devices, icons are imbued with cultural meanings and can oftentimes lead to the preservation of stereotypes. This review concludes with an examination of icons’ perpetuation of – and challenge to – cultural stereotypes.

CV-22 - Map interpretation
  • Identify the landforms represented by specific patterns in contours on a topographic map
  • Hypothesize about geographic processes by synthesizing the patterns found on one or more thematic maps or data visualizations
  • Match features on a map to corresponding features in the world
  • Compare and contrast the interpretation of landscape, geomorphic features, and human settlement types shown on a series of topographic maps from several different countries
CV-30 - Map Production and Management

Map production describes the experience of managing the many aspects and details of map creation. Often the map product is created for someone else—a client, supervisor, or instructor. Describing the intention of the map and evaluating available resources ahead of the project can help the cartographer define content requirements, stay on task, and ultimately meet deadlines. The project management life cycle involves clear communication between the cartographer and client, with resolutions to common questions best addressed at the beginning of the project. The process then iteratively cycles through phases that include research and production, followed by quality control, and concludes with file preparation and delivery.

CV-06 - Map Projections

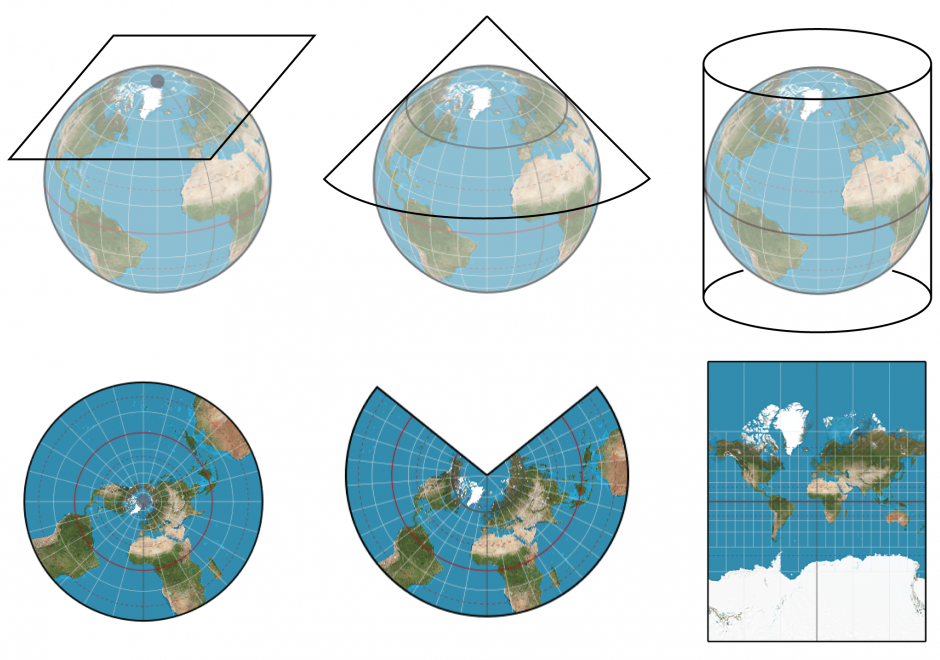
Map projection is the process of transforming angular (spherical / elliptical) coordinates into planar coordinates. All map projections introduce distortion (e.g., to areas, angles, distances) in the resulting planar coordinates. Understanding what, where, and how much distortion is introduced is an important consideration for spatial computations and visual interpretation of spatial patterns, as well as for general aesthetics of any map.

CV-21 - Map Reading

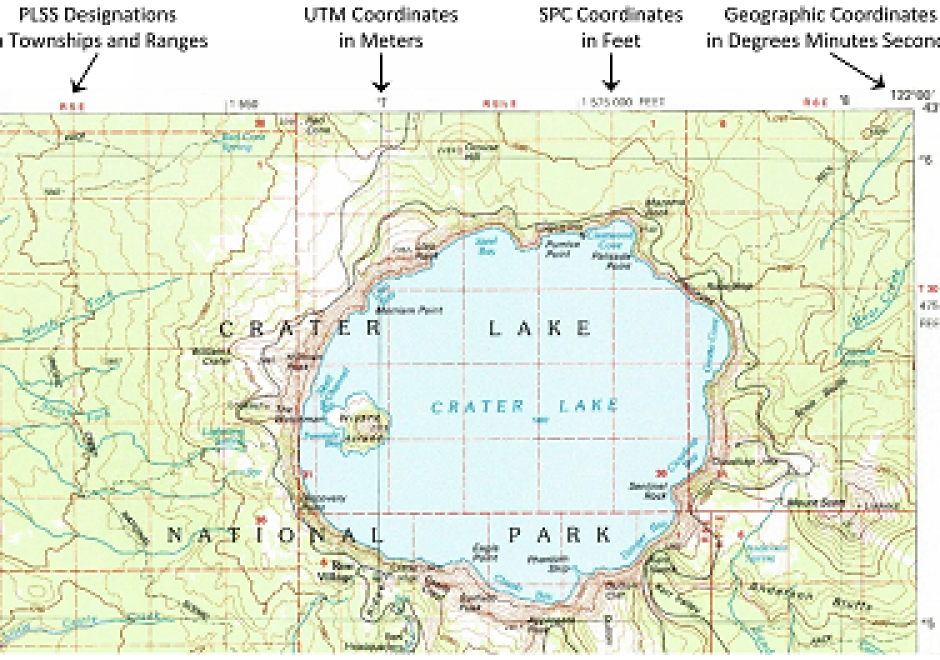
Map reading is the process of looking at the map to determine what is depicted and how the cartographer depicted it. This involves identifying the features or phenomena portrayed, the symbols and labels used, and information about the map that may not be displayed on the map. Reading maps accurately and effectively requires at least a basic understanding of how the mapmaker has made important cartographic decisions relating to map scale, map projections, coordinate systems, and cartographic compilation (selection, classification, generalization, and symbolization). Proficient map readers also appreciate artifacts of the cartographic compilation process that improve readability but may also affect map accuracy and uncertainty. Masters of map reading use maps to gain better understanding of their environment, develop better mental maps, and ultimately make better decisions. Through successful map reading, a person’s cartographic and mental maps will merge to tune the reader’s spatial thinking to the reality of the environment.

Pages