2018 QUARTER 01

A B C D E F G H I K L M N O P R S T U V W
DM-27 - Genealogical relationships: lineage, inheritance
  • Describe ways in which a geographic entity can be created from one or more others
  • Discuss the effects of temporal scale on the modeling of genealogical structures
  • Describe the genealogy (as identity-based change or temporal relationships) of particular geographic phenomena
  • Determine whether it is important to represent the genealogy of entities for a particular application
AM-78 - Genetic algorithms and artificial genomes
  • Create an artificial genome that can be used in a genetic algorithm to solve a specific problem
  • Describe a cluster in a way that could be represented in a genome
  • Explain how and why the representation of a GA’s chromosome strings can enhance or hinder the effectiveness of the GA
  • Use one of the many freely available GA packages to apply a GA to implement a simple genetic algorithm to a simple problem, such as optimizing the location of one or more facilities or optimizing the selection of habitat for a nature preserve geospatial pattern optimization (such as for finding clusters of disease points)
  • Describe a potential solution for a problem in a way that could be represented in a chromosome and evaluated according to some measure of fitness (such as the total distance everyone travels to the facility or the diversity of plants and animals that would be protected) genome
AM-77 - Genetic algorithms and global solutions
  • Describe the difficulty of finding globally optimal solutions for problems with many local optima
  • Explain how evolutionary algorithms may be used to search for solutions
  • Explain the important advantage that GA methods may offer to find diverse near-optimal solutions
  • Explain how a GA searches for solutions by using selection proportional to fitness, crossover, and (very low levels of) mutation to fitness criteria and crossover mutation to search for a globally optimal solution to a problem
  • Compare and contrast the effectiveness of multiple search criteria for finding the optimal solution with a simple greedy hill climbing approach
DM-47 - Geographic coordinate system
  • Distinguish between various latitude definitions (e.g., geocentric, geodetic, astronomic latitudes)
  • Explain the angular measurements represented by latitude and longitude coordinates
  • Calculate the latitude and longitude coordinates of a given location on the map using the coordinate grid ticks in the collar of a topographic map and the appropriate interpolation formula
  • Mathematically express the relationship between Cartesian coordinates and polar coordinates
  • Calculate the uncertainty of a ground position defined by latitude and longitude coordinates specified in decimal degrees to a given number of decimal places
  • Use GIS software and base data encoded as geographic coordinates to geocode a list of address-referenced locations
  • Locate on a globe the positions represented by latitude and longitude coordinates
  • Write an algorithm that converts geographic coordinates from decimal degrees (DD) to degrees, minutes, seconds (DMS) format
FC-22 - Geometric primitives
  • Identify the three fundamental dimensionalities used to represent points, lines, and areas
  • Describe the data models used to encode coordinates as points, lines, or polygons
  • Critique the assumptions that are made in representing the world as points, lines, and polygons
  • Evaluate the correspondence between geographic phenomena and the shapes used to represent them
AM-65 - Geospatial data classification
  • Compare and contrast the assumptions and performance of parametric and non-parametric approaches to multivariate data classification
  • Describe three algorithms that are commonly used to conduct geospatial data classification
  • Explain the effect of including geospatial contiguity as an explicit neighborhood classification criterion
  • Compare and contrast the results of the neural approach to those obtained using more traditional Gaussian maximum likelihood classification (available in most remote sensing systems)
DA-25 - Geospatial Intelligence and National Security

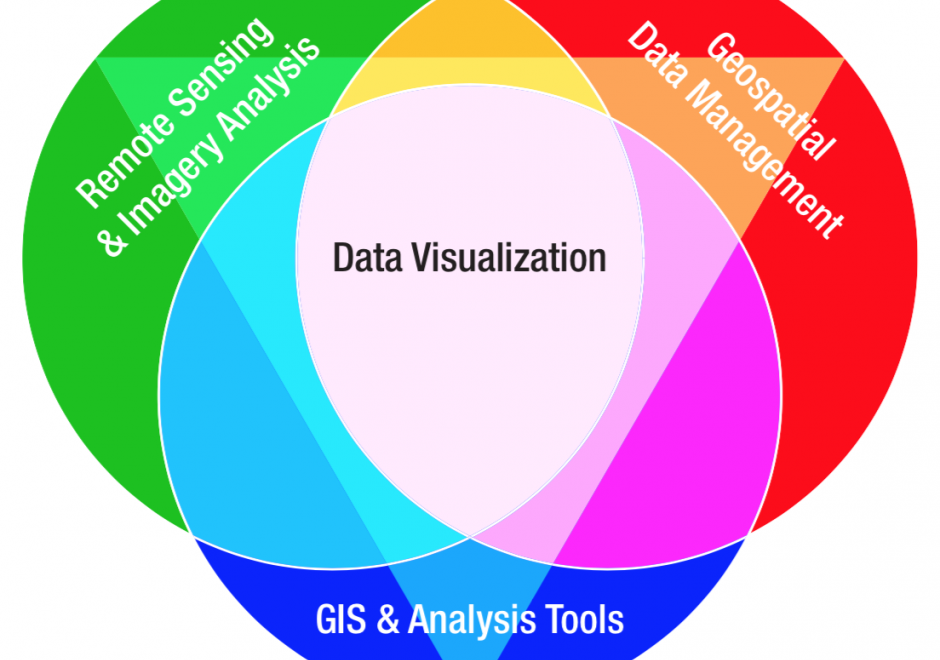
GIS&T exists within the national security enterprise as a multidisciplinary field that is now commonly referred to as Geospatial Intelligence (GEOINT).  U.S. GEOINT operations are principally managed by the National Geospatial-Intelligence Agency (NGA). GEOINT is one among several types of intelligence produced in support of national security, along with Human Intelligence (HUMINT), Signals Intelligence (SIGINT), Measurement and Signatures Intelligence (MASINT), and Open Source Intelligence (OSINT). Primary technical GEOINT skill areas include remote sensing, GIS, data management, and data visualization. The intelligence tradecraft is historically characterized as a process involving tasking, collection, processing, exploitation, and dissemination (TCPED), and supports decision-making for military, defense, and intelligence operations. The GEOINT enterprise utilizes every type of data collection platform, sensor, and imagery to develop intelligence reports. GEOINT products are used to support situational awareness, safety of navigation, arms control treaty monitoring, natural disaster response, and humanitarian relief operations. Geospatial analysts employed in government positions by NGA or serving in the U.S. armed forces are required to qualify in NGA’s GEOINT Professional Certification (GPC) program, and industry contractors have the option of qualifying under the United States Geospatial Intelligence Foundation (USGIF) Certified GEOINT Professional (CGP) program.

CV-36 - Geovisual Analytics

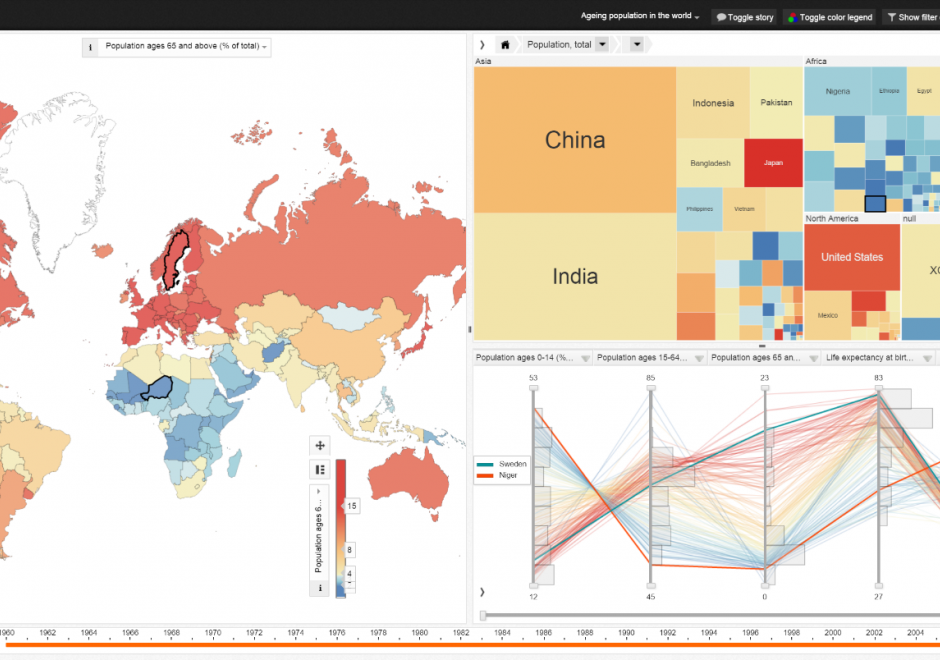
Geovisual analytics refers to the science of analytical reasoning with spatial information as facilitated by interactive visual interfaces. It is distinguished by its focus on novel approaches to analysis rather than novel approaches to visualization or computational methods alone. As a result, geovisual analytics is usually grounded in real-world problem solving contexts. Research in geovisual analytics may focus on the development of new computational approaches to identify or predict patterns, new visual interfaces to geographic data, or new insights into the cognitive and perceptual processes that users apply to solve complex analytical problems. Systems for geovisual analytics typically feature a high-degree of user-driven interactivity and multiple visual representation types for spatial data. Geovisual analytics tools have been developed for a variety of problem scenarios, such as crisis management and disease epidemiology. Looking ahead, the emergence of new spatial data sources and display formats is expected to spur an expanding set of research and application needs for the foreseeable future. 

DA-01 - GIS&T and Agriculture

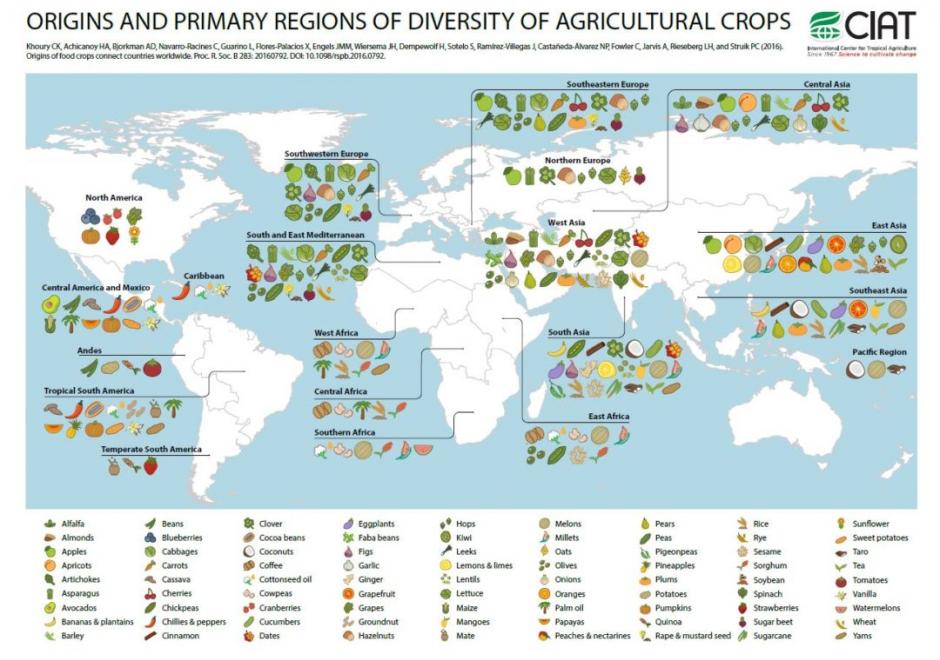
Agriculture, whether in the Corn Belt of the United States, the massive rice producing areas of Southeast Asia, or the bean harvest of a smallholder producer in Central America, is the basis for feeding the world. Agriculture systems are highly complex and heterogeneous in both space and time. The need to contextualize this complexity and to make more informed decisions regarding agriculture has led to GIS&T approaches supporting the agricultural sciences in many different areas. Agriculture represents a rich resource of spatiotemporal data and different problem contexts; current and future GIScientists should look toward agricultural as a potentially rewarding area of investigation and, likewise, one where new approaches have the potential to help improve the food, environmental, and economic security of people around the world.

DA-04 - GIS&T and Civil Engineering

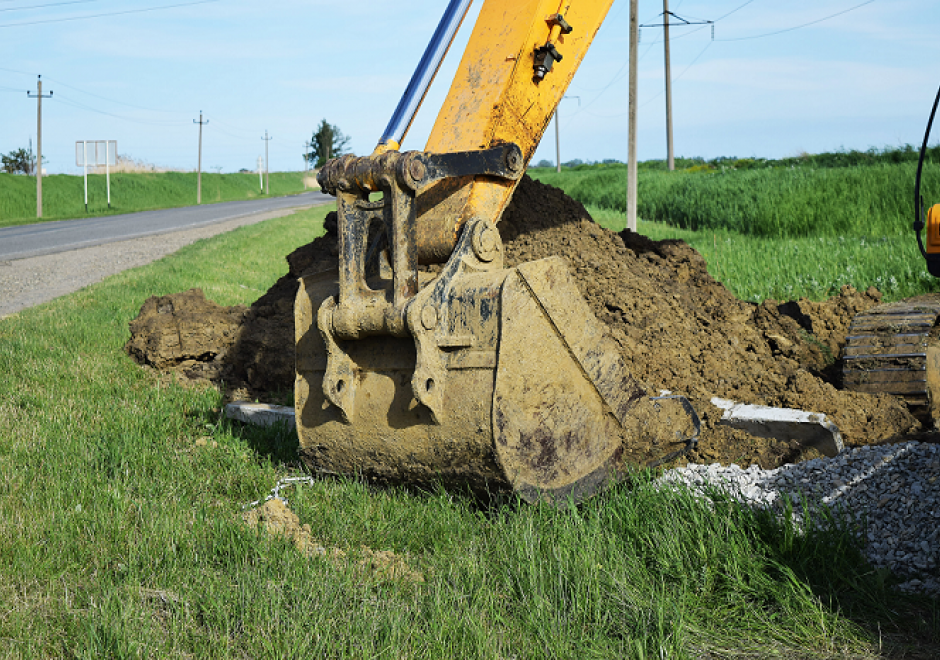
Civil Engineering, which includes sub-disciplines such as environmental, geotechnical, structural, and water resource engineering, is increasingly dependent on the GIS&T for the planning, design, operation and management of civil engineering infrastructure systems.  Typical tasks include the management of spatially referenced data sets, analytic modeling for making design decisions and estimating likely system behavior and impacts, and the visualization of systems for the decision-making process and garnering stakeholder support.

Pages