2018 QUARTER 02

A B C D E F G H I K L M N O P R S T U V W
DC-08 - Sample intervals
  • Identify the fundamental principle of the sampling theorem for specifying a sampling rate or interval
  • Discuss what sampling intervals should be used to investigate some of the temporal patterns encountered in oceanography
  • Propose a sampling strategy considering a variable range in autocorrelation distances for a variable
DC-06 - Sample size selection
  • Determine the minimum number and distribution of point samples for a given study area and a
  • Determine minimum homogeneous ground area for a particular application
  • Describe how spatial autocorrelation influences selection of sample size and sample statistics
  • Assess the practicality of statistically reliable sampling in a given situation
  • given statistical test of thematic accuracy
CV-04 - Scale and Generalization
Scale and generalization are two fundamental, related concepts in geospatial data. Scale has multiple meanings depending on context, both within geographic information science and in other disciplines. Typically it refers to relative proportions between objects in the real world and their representations. Generalization is the act of modifying detail, usually reducing it, in geospatial data. It is often driven by a need to represent data at coarsened resolution, being typically a consequence of reducing representation scale. Multiple computations and graphical modication processes can be used to achieve generalization, each introducing increased abstraction to the data, its symbolization, or both.
AM-28 - Semi-variogram modeling
  • List the possible sources of error in a selected and fitted model of an experimental semi-variogram
  • Describe the conditions under which each of the commonly used semi-variograms models would be most appropriate
  • Explain the necessity of defining a semi-variogram model for geographic data
  • Apply the method of weighted least squares and maximum likelihood to fit semi-variogram models to datasets
  • Describe some commonly used semi-variogram models
FC-11 - Set Theory
  • Describe set theory
  • Explain how logic theory relates to set theory
  • Perform a logic (set theoretic) query using GIS software
  • Explain how set theory relates to spatial queries
FC-15 - Shape

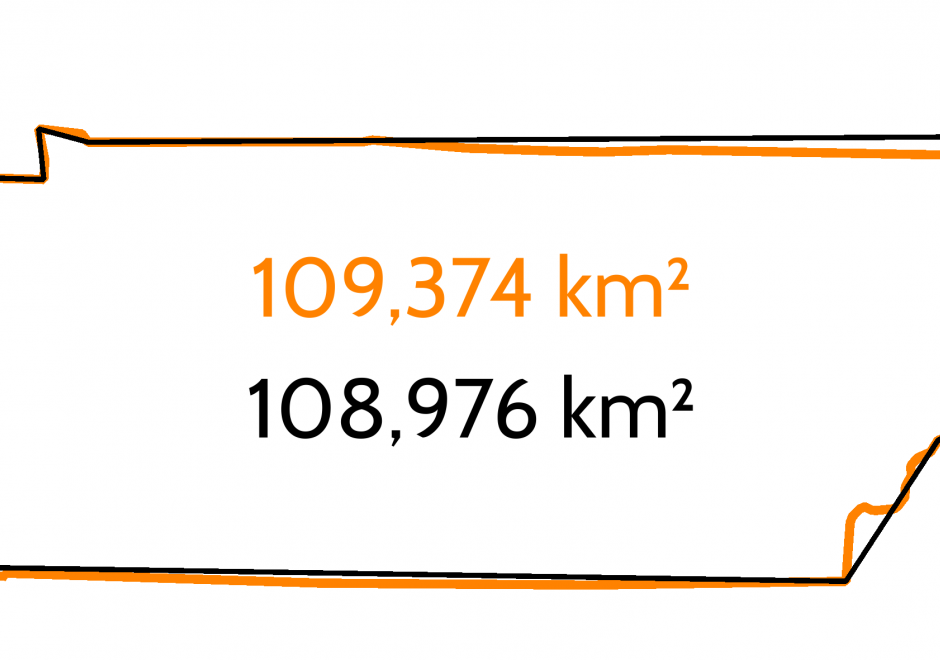
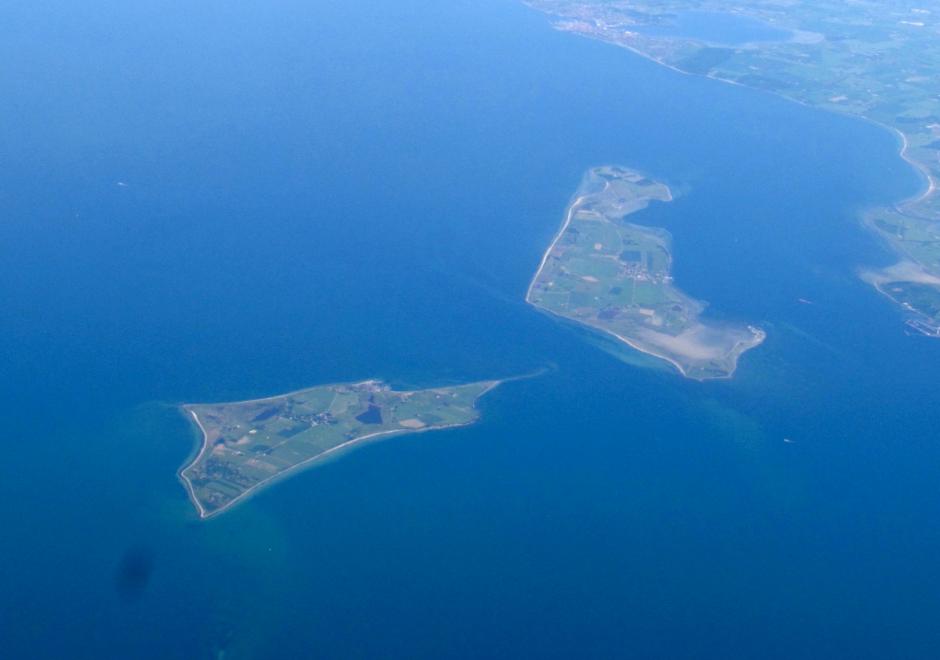
Shape is important in GI Science because the shape of a geographical entity can have far-reaching effects on significant characteristics of that entity. In geography we are mainly concerned with two-dimensional shapes such as the outlines of islands, lakes, and administrative areas, but three-dimensional shapes may become important, for example in the treatment of landforms. Since the attribute of shape has infinitely many degrees of freedom, there can be no single numerical measure such that closely similar shapes are assigned close numerical values. Therefore different shape descriptors have been proposed for different purposes. Although it is generally desirable for a shape descriptor to be scale invariant and rotation invariant, not all proposed descriptors satisfy both these requirements. Some methods by which a shape is described using a single number are described, followed by a discussion of moment-based approaches. It is often useful to represent a complex shape by means of a surrogate shape of simpler form which facilitates storage, manipulation, and comparison between shapes; some examples of commonly used shape surrogates are presented. Another important task is to compare different shapes to determine how similar they are. The article concludes with a discussion of a number of such measures of similarity.

AM-76 - Simulated annealing
  • Outline the rationale for and usefulness of simulated annealing
AM-84 - Simulation modeling
  • Conduct an experiment using simulation techniques from an activity perspective
  • Explain how a simulation from an activity perspective can be used in transportation
  • Discuss important computational laboratory tools for creating new models and visualizing model simulations and model outcomes
  • Discuss whether, when prior information is absent, repeatedly generating random synthetic datasets can be used to provide statistical significance
  • Discuss Monte Carlo simulation use in GIS&T
  • Discuss effective scientific use of supervisory genetic algorithms with agent-based simulation models
  • Describe how supervisory search and optimization methods can be used to analyze key characteristics of initial conditions and results and to optimize results based on systematic targeted search through the parameter and random seed spaces
GS-16 - Social critiques
  • Explain the argument that, throughout history, maps have been used to depict social relations
  • Explain the argument that GIS is “socially constructed”
  • Describe the use of GIS from a political ecology point of view (e.g., consider the use of GIS for resource identification, conservation, and allocation by an NGO in Sub-Saharan Africa)
  • Defend or refute the contention that critical studies have an identifiable influence on the development of the information society in general and GIScience in particular
  • Discuss the production, maintenance, and use of geospatial data by a government agency or private firm from the perspectives of a taxpayer, a community organization, and a member of a minority group
  • Explain how a tax assessor’s office adoption of GIS&T may affect power relations within a community
CP-10 - Social Media Analytics

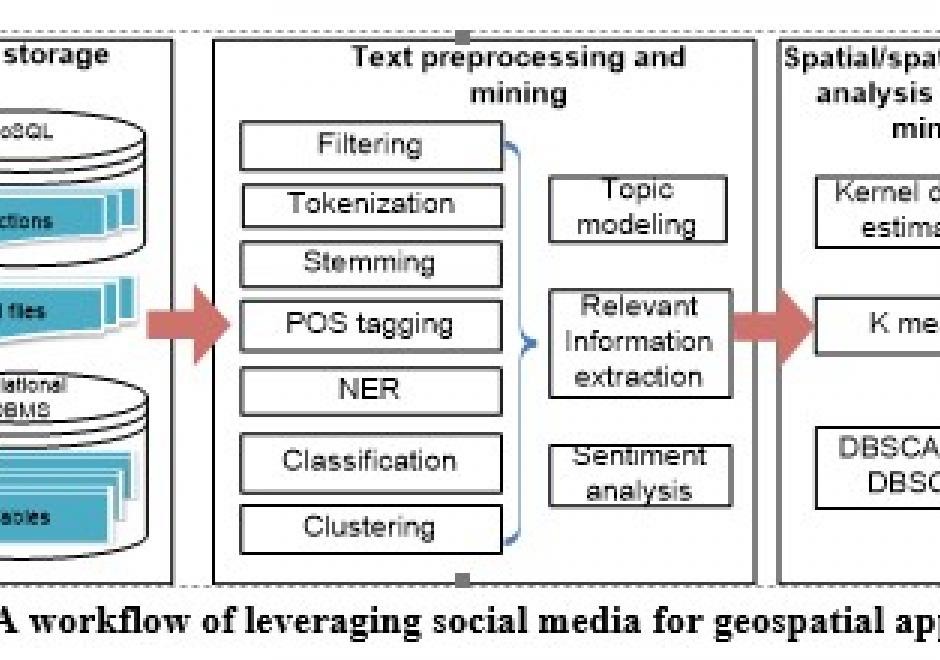
Social media streams have emerged as new sources to support various geospatial applications. However, traditional geospatial tools and systems lack the capacities to process such data streams, which are generated dynamically in extremely large volumes and with versatile contents. Therefore, innovative approaches and frameworks should be developed to detect an emerging event discussed over the social media, understand the extent, consequences of the event, as well as it time-evolving nature, and eventually discover useful patterns. In order to harness social media for geospatial applications, this entry introduces social media analytics technologies for harvesting, managing, mining, analyzing and visualizing the spatial, temporal, text, and network information of social media data.

Pages