2018 QUARTER 02

A B C D E F G H I K L M N O P R S T U V W
GS-01 - The legal regime
  • Discuss ways in which the geospatial profession is regulated under the U.S. legal regime
  • Compare and contrast the relationship of the geospatial profession and the U.S. legal regime with similar relationships in other countries
DM-15 - The network model
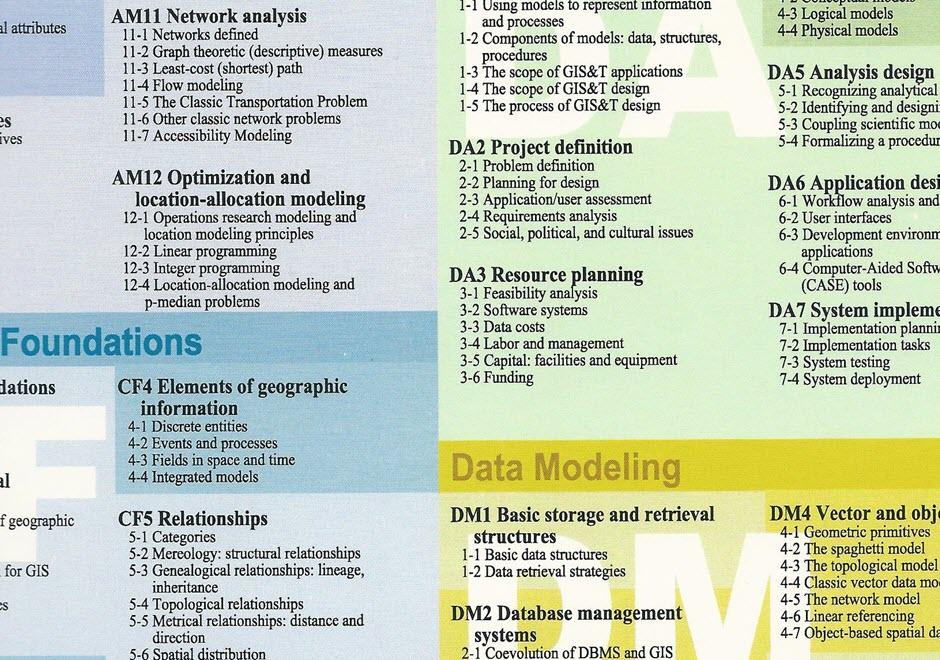
  • Define the following terms pertaining to a network: Loops, multiple edges, the degree of a vertex, walk, trail, path, cycle, fundamental cycle
  • List definitions of networks that apply to specific applications or industries
  • Create an adjacency table from a sample network
  • Explain how a graph can be written as an adjacency matrix and how this can be used to calculate topological shortest paths in the graph
  • Create an incidence matrix from a sample network
  • Explain how a graph (network) may be directed or undirected
  • Demonstrate how attributes of networks can be used to represent cost, time, distance, or many other measures
  • Demonstrate how the star (or forward star) data structure, which is often employed when digitally storing network information, violates relational normal form, but allows for much faster search and retrieval in network databases
  • Discuss some of the difficulties of applying the standard process-pattern concept to lines and networks
  • Demonstrate how a network is a connected set of edges and vertices
FC-20 - The power of maps
  • Describe how maps such as topographic maps are produced within certain relations of power and knowledge
  • Discuss how the choices used in the design of a road map will influence the experience visitors may have of the area
  • Explain how legal issues impact the design and content of such special purpose maps as subdivision plans, nautical charts, and cadastral maps
  • Exemplify maps that illustrate the provocative, propagandistic, political, and persuasive nature of maps and geospatial data
  • Demonstrate how different methods of data classification for a single dataset can produce maps that will be interpreted very differently by the user
  • Deconstruct the silences (feature omissions) on a map of a personally well known area
  • Construct two maps about a conflict or war producing one supportive of each side’s viewpoint
KE-01 - The process of GIS&T design
  • Describe the major approaches to the design of geospatial systems
  • Analyze past cases to identify best practices of design and implementation
  • Compare and contrast the relative merits of the use-case driven and architecture-centric design processes
DM-07 - The Raster Data Model

The raster data model is a widely used method of storing geographic data. The model most commonly takes the form of a grid-like structure that holds values at regularly spaced intervals over the extent of the raster. Rasters are especially well suited for storing continuous data such as temperature and elevation values, but can hold discrete and categorical data such as land use as well.  The resolution of a raster is given in linear units (e.g., meters) or angular units (e.g., one arc second) and defines the extent along one side of the grid cell. High (or fine) resolution rasters have comparatively closer spacing and more grid cells than low (or coarse) resolution rasters, and require relatively more memory to store. Active research in the domain is oriented toward improving compression schemes and implementation for alternative cell shapes (such as hexagons), and better supporting multi-resolution raster storage and analysis functions.

DM-12 - The spaghetti model
  • Identify a widely-used example of the spaghetti model (e.g., AutoCAD DWF, ESRI shapefile)
  • Write a program to read and write a vector data file using a common published format
  • Explain the conditions under which the spaghetti model is useful
  • Explain how the spaghetti data model embodies an object-based view of the world
  • Describe how geometric primitives are implemented in the spaghetti model as independent objects without topology
DM-13 - The topological model
  • Define terms related to topology (e.g., adjacency, connectivity, overlap, intersect, logical consistency)
  • Describe the integrity constraints of integrated topological models (e.g., POLYVRT)
  • Discuss the historical roots of the Census Bureau’s creation of GBF/DIME as the foundation for the development of topological data structures
  • Explain why integrated topological models have lost favor in commercial GIS software
  • Evaluate the positive and negative impacts of the shift from integrated topological models
  • Discuss the role of graph theory in topological structures
  • Exemplify the concept of planar enforcement (e.g., TIN triangles)
  • Demonstrate how a topological structure can be represented in a relational database structure
  • Explain the advantages and disadvantages of topological data models
  • Illustrate a topological relation
DM-10 - The Triangulated Irregular Network (TIN) model
  • Describe how to generate a unique TIN solution using Delaunay triangulation
  • Describe the architecture of the TIN model
  • Construct a TIN manually from a set of spot elevations
  • Delineate a set of break lines that improve the accuracy of a TIN
  • Describe the conditions under which a TIN might be more practical than GRID
  • Demonstrate the use of the TIN model for different statistical surfaces (e.g., terrain elevation, population density, disease incidence) in a GIS software application
FC-27 - Thematic accuracy
  • Explain the distinction between thematic accuracy, geometric accuracy, and topological fidelity
  • Outline the SDTS and ISO TC211 standards for thematic accuracy
  • Discuss how measures of spatial autocorrelation may be used to evaluate thematic accuracy
  • Describe the component measures and the utility of a misclassification matrix
  • Describe the different measurement levels on which thematic accuracy is based
AM-86 - Theory of error propagation
  • Describe stochastic error models
  • Exemplify stochastic error models used in GIScience

Pages