2018 QUARTER 02

A B C D E F G H I K L M N O P R S T U V W
FC-22 - Geometric primitives
  • Identify the three fundamental dimensionalities used to represent points, lines, and areas
  • Describe the data models used to encode coordinates as points, lines, or polygons
  • Critique the assumptions that are made in representing the world as points, lines, and polygons
  • Evaluate the correspondence between geographic phenomena and the shapes used to represent them
AM-65 - Geospatial data classification
  • Compare and contrast the assumptions and performance of parametric and non-parametric approaches to multivariate data classification
  • Describe three algorithms that are commonly used to conduct geospatial data classification
  • Explain the effect of including geospatial contiguity as an explicit neighborhood classification criterion
  • Compare and contrast the results of the neural approach to those obtained using more traditional Gaussian maximum likelihood classification (available in most remote sensing systems)
DA-25 - Geospatial Intelligence and National Security

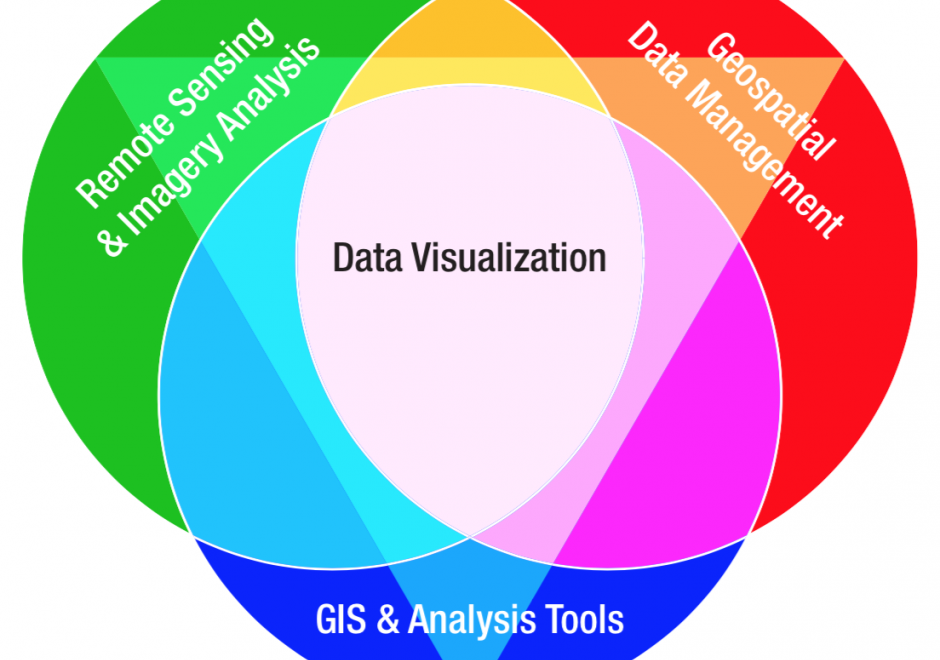
GIS&T exists within the national security enterprise as a multidisciplinary field that is now commonly referred to as Geospatial Intelligence (GEOINT).  U.S. GEOINT operations are principally managed by the National Geospatial-Intelligence Agency (NGA). GEOINT is one among several types of intelligence produced in support of national security, along with Human Intelligence (HUMINT), Signals Intelligence (SIGINT), Measurement and Signatures Intelligence (MASINT), and Open Source Intelligence (OSINT). Primary technical GEOINT skill areas include remote sensing, GIS, data management, and data visualization. The intelligence tradecraft is historically characterized as a process involving tasking, collection, processing, exploitation, and dissemination (TCPED), and supports decision-making for military, defense, and intelligence operations. The GEOINT enterprise utilizes every type of data collection platform, sensor, and imagery to develop intelligence reports. GEOINT products are used to support situational awareness, safety of navigation, arms control treaty monitoring, natural disaster response, and humanitarian relief operations. Geospatial analysts employed in government positions by NGA or serving in the U.S. armed forces are required to qualify in NGA’s GEOINT Professional Certification (GPC) program, and industry contractors have the option of qualifying under the United States Geospatial Intelligence Foundation (USGIF) Certified GEOINT Professional (CGP) program.

CV-36 - Geovisual Analytics

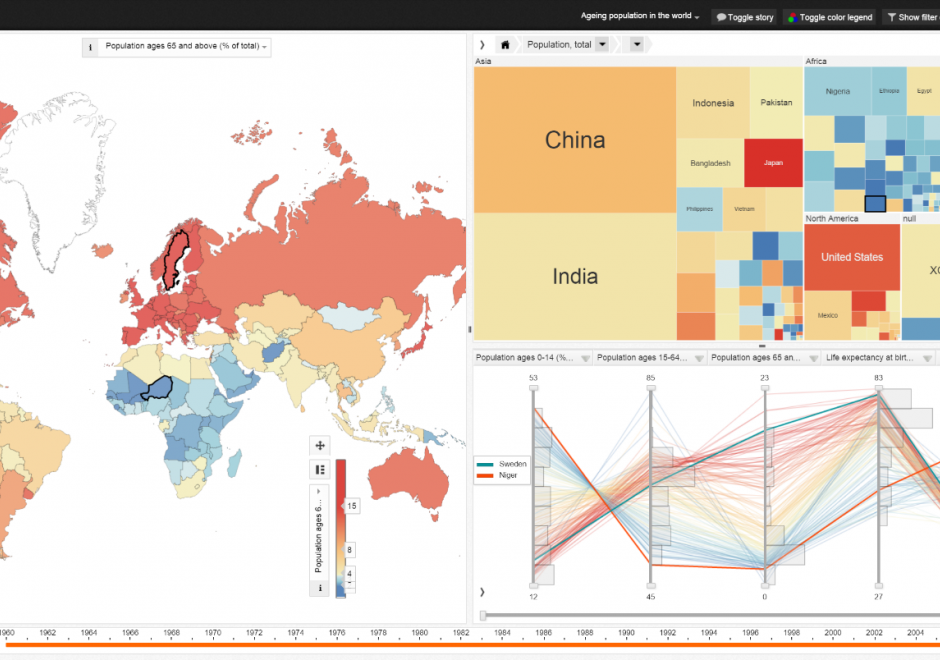
Geovisual analytics refers to the science of analytical reasoning with spatial information as facilitated by interactive visual interfaces. It is distinguished by its focus on novel approaches to analysis rather than novel approaches to visualization or computational methods alone. As a result, geovisual analytics is usually grounded in real-world problem solving contexts. Research in geovisual analytics may focus on the development of new computational approaches to identify or predict patterns, new visual interfaces to geographic data, or new insights into the cognitive and perceptual processes that users apply to solve complex analytical problems. Systems for geovisual analytics typically feature a high-degree of user-driven interactivity and multiple visual representation types for spatial data. Geovisual analytics tools have been developed for a variety of problem scenarios, such as crisis management and disease epidemiology. Looking ahead, the emergence of new spatial data sources and display formats is expected to spur an expanding set of research and application needs for the foreseeable future. 

CV-35 - Geovisualization

Geovisualization is primarily understood as the process of interactively visualizing geographic information in any of the steps in spatial analyses, even though it can also refer to the visual output (e.g., plots, maps, combinations of these), or the associated techniques. Rooted in cartography, geovisualization emerged as a research thrust with the leadership of Alan MacEachren (Pennsylvania State University) and colleagues when interactive maps and digitally-enabled exploratory data analysis led to a paradigm shift in 1980s and 1990s. A core argument for geovisualization is that visual thinking using maps is integral to the scientific process and hypothesis generation, and the role of maps grew beyond communicating the end results of an analysis or documentation process. As such, geovisualization interacts with a number of disciplines including cartography, visual analytics, information visualization, scientific visualization, statistics, computer science, art-and-design, and cognitive science; borrowing from and contributing to each. In this entry, we provide a definition and a brief history of geovisualization including its fundamental concepts, elaborate on its relationship to other disciplines, and briefly review the skills/tools that are relevant in working with geovisualization environments. We finish the entry with a list of learning objectives, instructional questions, and additional resources.

GS-14 - GIS and Critical Ethics

This entry discusses and defines ethical critiques and GIS. It complements other GIS&T Body of Knowledge entries on Professional and Practical Ethics and Codes of Ethics for GIS Professionals. Critical ethics is presented as the attempt to provide a better understanding of data politics. Knowledge is never abstract or non-material. Spatial data, as a form of knowledge, may mask, conceal, disallow or disavow, even as it speaks, permits and claims. A critical ethics of GIS investigates this situated power-knowledge. Two concepts from educational pedagogy are suggested: threshold and troublesome knowledge. As we use and continue to learn GIS, these concepts may enrich our experience by usefully leading us astray. This points finally to how ethical critique is practical, empirical and political, rather than abstract or theoretical.

DA-01 - GIS&T and Agriculture

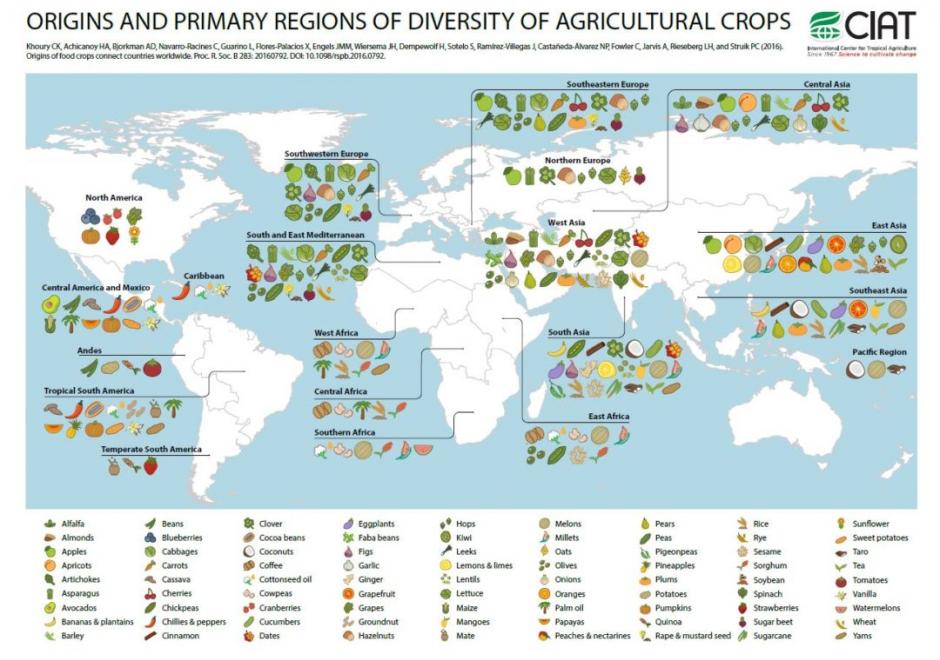
Agriculture, whether in the Corn Belt of the United States, the massive rice producing areas of Southeast Asia, or the bean harvest of a smallholder producer in Central America, is the basis for feeding the world. Agriculture systems are highly complex and heterogeneous in both space and time. The need to contextualize this complexity and to make more informed decisions regarding agriculture has led to GIS&T approaches supporting the agricultural sciences in many different areas. Agriculture represents a rich resource of spatiotemporal data and different problem contexts; current and future GIScientists should look toward agricultural as a potentially rewarding area of investigation and, likewise, one where new approaches have the potential to help improve the food, environmental, and economic security of people around the world.

DA-04 - GIS&T and Civil Engineering

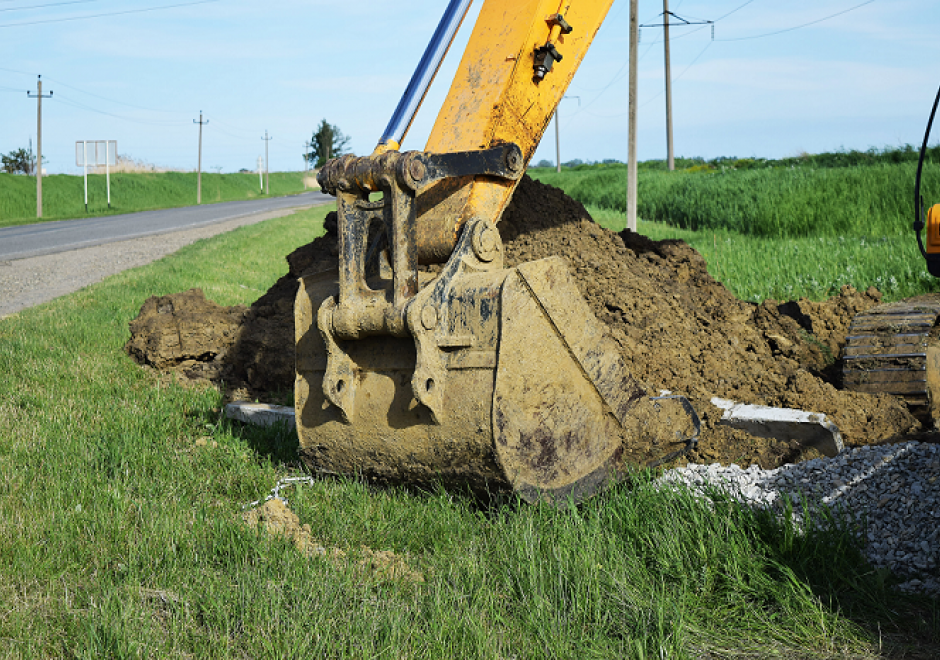
Civil Engineering, which includes sub-disciplines such as environmental, geotechnical, structural, and water resource engineering, is increasingly dependent on the GIS&T for the planning, design, operation and management of civil engineering infrastructure systems.  Typical tasks include the management of spatially referenced data sets, analytic modeling for making design decisions and estimating likely system behavior and impacts, and the visualization of systems for the decision-making process and garnering stakeholder support.

DA-37 - GIS&T and Epidemiology

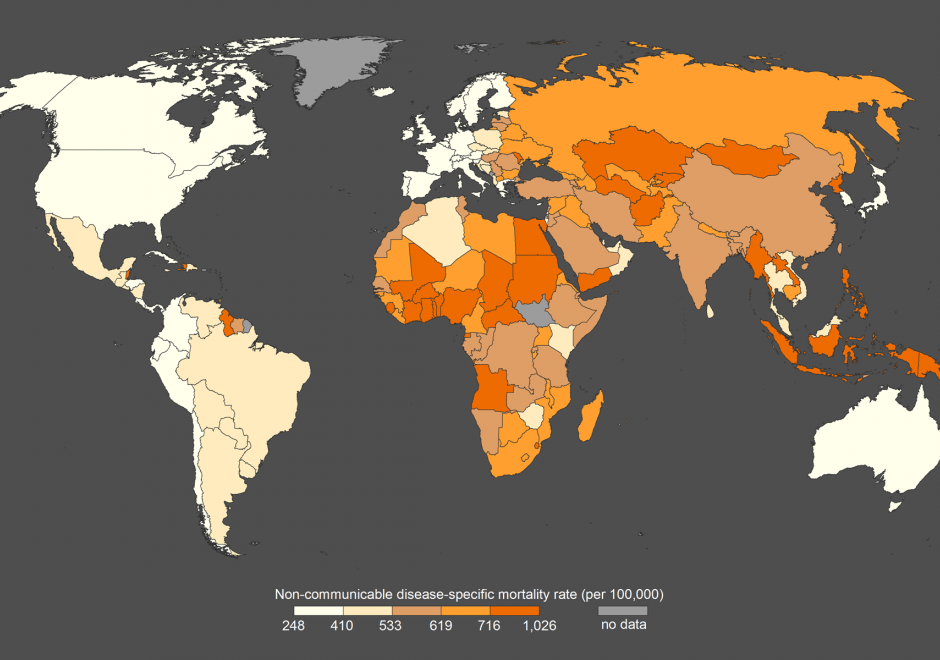
Location plays an important role in human health. Where we live, work, and spend our time is associated with different exposures, which may influence the risk of developing disease. GIS has been used to answer key research questions in epidemiology, which is the study of the distribution and determinants of disease. These research questions include describing and visualizing spatial patterns of disease and risk factors, exposure modeling of geographically varying environmental variables, and linking georeferenced information to conduct studies testing hypotheses regarding exposure-disease associations. GIS has been particularly instrumental in environmental epidemiology, which focuses on the physical, chemical, biological, social, and economic factors affecting health. Advances in personal exposure monitoring, exposome research, and artificial intelligence are revolutionizing the way GIS can be integrated with epidemiology to study how the environment may impact human health.

DA-16 - GIS&T and Forestry

GIS applications in forestry are as diverse as the subject itself. Many foresters match a common stereotype as loggers and firefighters, but many protect wildlife, manage urban forests, enhance water quality, provide for recreation, and plan for a sustainable future.  A broad range of management goals drives a broad range of spatial methods, from adjacency functions to zonal analysis, from basic field measurements to complex multi-scale modeling. As such, it is impossible to describe the breadth of GIS&T in forestry. This review will cover core ways that geospatial knowledge improves forest management and science, and will focus on supporting core competencies.  

Pages