2018 QUARTER 03

A B C D E F G H I K L M N O P R S T U V W
DM-14 - Classic vector data models
  • Illustrate the GBF/DIME data model
  • Describe a Freeman-Huffman chain code
  • Describe the relationship of Freeman-Huffman chain codes to the raster model
  • Discuss the impact of early prototype data models (e.g., POLYVRT and GBF/DIME) on contemporary vector formats
  • Describe the relationship between the GBF/DIME and TIGER structures, the rationale for their design, and their intended primary uses, paying particular attention to the role of graph theory in establishing the difference between GBF/DIME and TIGER files
  • Discuss the advantages and disadvantages of POLYVRT
  • Explain what makes POLYVRT a hierarchical vector data model
AM-09 - Cluster analysis
  • Identify several cluster detection techniques and discuss their limitations
  • Demonstrate the extension of spatial clustering to deal with clustering in space-time using the Know and Mantel tests
  • Perform a cluster detection analysis to detect “hot spots” in a point pattern
  • Discuss the characteristics of the various cluster detection techniques
GS-12 - Codes of ethics for geospatial professionals
  • Compare and contrast the ethical guidelines promoted by the GIS Certification Institute (GISCI) and the American Society for Photogrammetry and Remote Sensing (ASPRS)
  • Propose a resolution to a conflict between an obligation in the GIS Code of Ethics and organizations’ proprietary interests
  • Explain how one or more obligations in the GIS Code of Ethics may conflict with organizations’ proprietary interests
  • Describe the sanctions imposed by ASPRS and GISCI on individuals whose professional actions violate the codes of ethics
CV-09 - Color Theory
  • List the range of factors that should be considered in selecting colors
  • Discuss the role of “gamut” in choosing colors that can be reproduced on various devices and media
  • Explain how real-world connotations (e.g., blue=water, white=snow) can be used to determine color selections on maps
  • Exemplify colors for different forms of harmony, concordance, and balance
  • Estimate RGB (red, green, blue) primary amounts in a selection of colors
  • Plan color proofing suited for checking a map publication job
  • Select colors appropriate for map readers with color limitations
  • Specify a set of colors in device-independent Commision Internationale de L’Eclairage (CIE) specifications
  • Determine the CMYK (cyan, magenta, yellow, and black) primary amounts in a selection of colors
  • Select a color scheme (e.g., qualitative, sequential, diverging, spectral) that is appropriate for a given map purpose and variable
  • Describe how cultural differences with respect to color associations impact map design
  • Describe the common color models used in mapping
  • Describe color decisions made for various production workflows
PD-12 - Commercialization of GIS Applications

The commercialization of GIS applications refers to the process of bringing a software solution to market. The process involves three broad categories of tasks: identifying a problem or aspect of a problem that a GIS application can solve or address; designing and creating a GIS application to address the problem; and developing and executing a marketing plan to reach those with the problem, the potential users. Ideally these categories would be addressed in this order, but in practice, aspects of each are likely to be addressed and iterated throughout the commercialization process.

Bringing a GIS application to market requires expertise in 1) the target industry or market (e.g., forestry); 2) software development (how to design and build a product); 3) law (licenses, contracts, taxes); and 4) business (how to fund development, guide the process, evaluate success, marketing). A single individual or organization, referred to as the provider in this discussion, may lead or execute all three categories of tasks, or engage third parties when specific expertise is required.

CV-11 - Common Thematic Map Types
  • Describe the design considerations for each of the following methods: choropleth, dasymetric, proportioned symbol, graduated symbol, isoline, dot, cartogram, and flow map
  • Evaluate the strengths and limitations of each of the following methods: choropleth, dasymetric, proportioned symbol, graduated symbol, isoline, dot, cartogram, and flow map
  • Explain why choropleth maps should (almost) never be used for mapping count data and suggest alternative methods for mapping count data
  • Choose suitable mapping methods for each attribute of a given type of feature in a GIS (e.g., roads with various attributes such as surface type, traffic flow, number of lanes, direction such as one-way)
  • Select base information suited to providing a frame of reference for thematic map symbols (e.g., network of major roads and state boundaries underlying national population map)
  • Create maps using each of the following methods: choropleth, dasymetric, proportioned symbol, graduated symbol, isoline, dot, cartogram, and flow
  • Create well-designed legends using the appropriate conventions for the following methods: choropleth, dasymetric, proportioned symbol, graduated symbol, isoline, dot, cartogram, and flow
GS-17 - Common-sense geographies
  • Identify common-sense views of geographic phenomena that sharply contrast with established theories and technologies of geographic information
  • Differentiate applications that can make use of common-sense principles of geography from those that should not
  • Collaborate with non-GIS experts who use GIS to design applications that match commonsense understanding to an appropriate degree
  • Effectively communicate the design, procedures, and results of GIS projects to non-GIS audiences (clients, managers, general public)
  • Evaluate the impact of geospatial technologies (e.g., Google Earth) that allow non-geospatial professionals to create, distribute, and map geographic information
KE-32 - Competence in GIS&T Knowledge Work

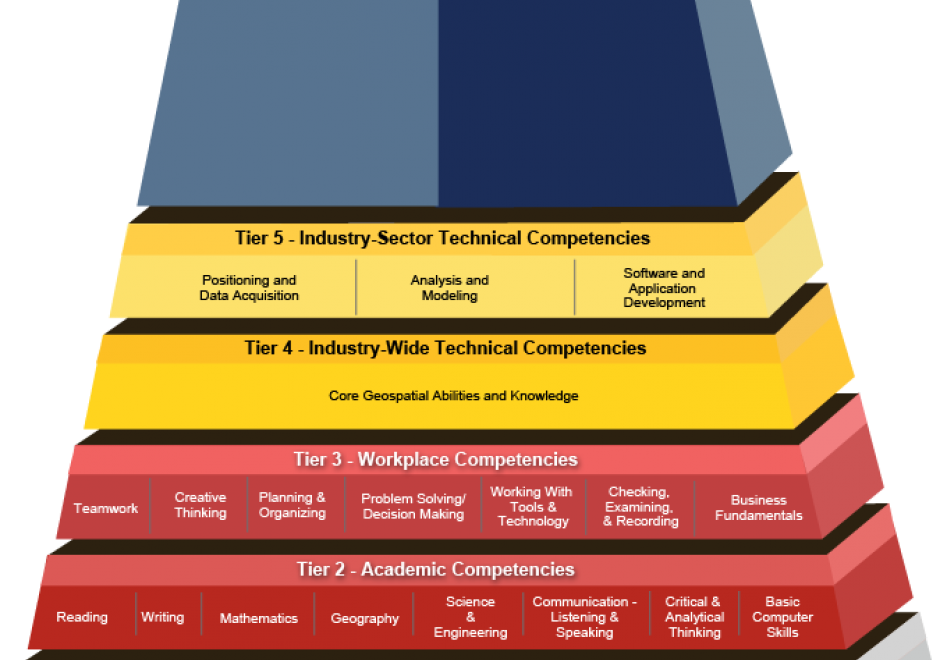
“Competence” is a word that rolls off the tongues of instructional designers, education administrators, and HR people. Others find it hard to swallow. For some GIS&T educators, competence connotes an emphasis on vocational instruction that’s unworthy of the academy. This entry challenges skeptical educators to rethink competence not just as readiness for an occupation, but first and foremost as the readiness to live life to the fullest, and to contribute to a sustainable future. The entry considers the OECD’s “Key Competencies for a Successful Life and Well-Functioning Society,” as well as the specialized GIS&T competencies specified in the U.S. Department of Labor’s Geospatial Technology Competency Model. It presents findings of a survey in which 226 self-selected members of Esri’s Young Professionals Network observe that competencies related to the GTCM’s Software and App Development Segment were under-developed in their university studies. Looking ahead, in the context of an uncertain future in which, some say, many workers are at risk of “technological unemployment,” the entry considers which GIS&T competencies are likely to be of lasting value.

AM-90 - Computational Movement Analysis

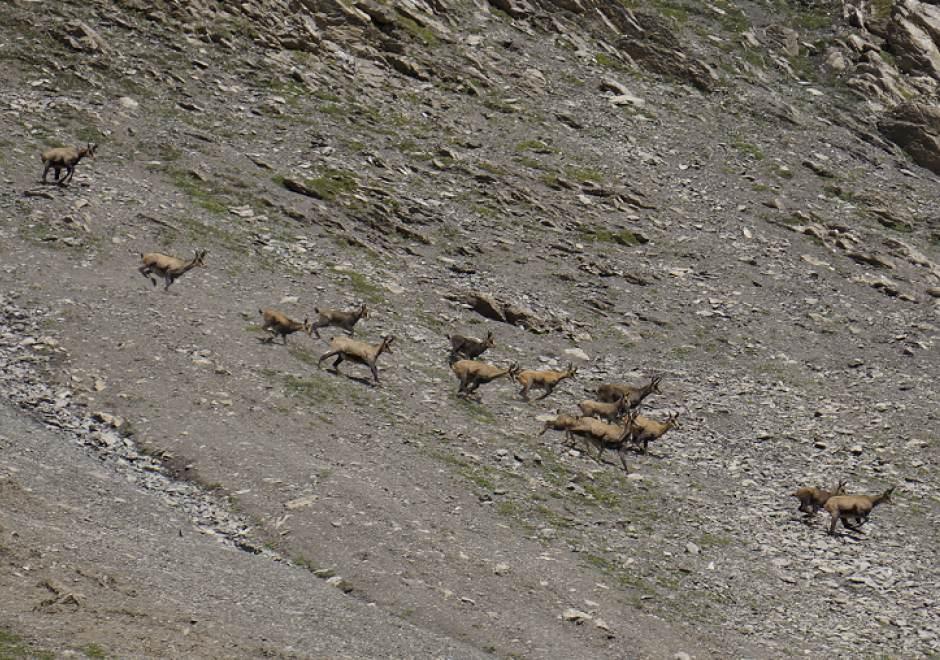
Figure 1. Group movement patterns as illustrated in this coordinated escape behavior of a group of mountain goat (Rubicapra rubicapra) evading approaching hikers on the Fuorcla Trupchun near the Italian/Swiss border are at the core of computational movement analysis. Once the trajectories of moving objects are collected and made accessible for computational processing, CMA aims at a better understanding of the characteristics of movement processes of animals, people or things in geographic space.


Computational Movement Analysis (CMA) develops and applies analytical computational tools aiming at a better understanding of movement data. CMA copes with the rapidly growing data streams capturing the mobility of people, animals, and things roaming geographic spaces. CMA studies how movement can be represented, modeled, and analyzed in GIS&T. The CMA toolbox includes a wide variety of approaches, ranging from database research, over computational geometry to data mining and visual analytics.

PD-04 - Computer-Aided Software Engineering (CASE) tools
  • Use CASE tools to design geospatial software
  • Evaluate available CASE tools for their appropriateness for a given development task

Pages