2018 QUARTER 04

A B C D E F G H I K L M N O P R S T U V W
CV-02 - Cartography and Technology
  • Discuss the impact that mapping on the Web via applications such as Google Earth have had on the practice of cartography
  • Explain how emerging technologies in related fields (e.g., the stereoplotter, aerial and satellite imagery, GPS and LiDAR, the World Wide Web, immersive and virtual environments) have advanced cartography and visualization methods
  • Explain how MacEachren’s Cartography-cubed (C3) concept can be used to understand the evolving role of cartography and visualization
  • Explain how software innovations such as Synagraphic Mapping System (SYMAP), Surfer, and automated contouring methods have affected the design of maps
  • Evaluate the advantages and limitations of various technological approaches to mapping
  • Select new technologies in related fields that have the most potential for use in cartography and visualization
AM-69 - Cellular Automata
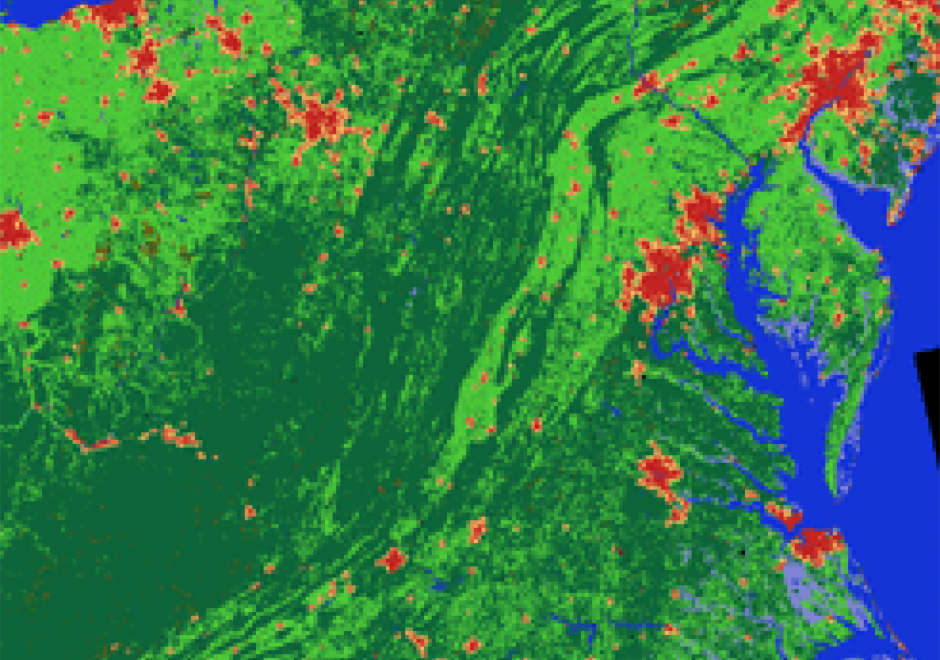
Cellular automata (CA) are simple models that can simulate complex processes in both space and time. A CA consists of six defining components: a framework, cells, a neighborhood, rules, initial conditions, and an update sequence. CA models are simple, nominally deterministic yet capable of showing phase changes and emergence, map easily onto the data structures used in geographic information systems, and are easy to implement and understand. This has contributed to their popularity for applications such as measuring land use changes and monitoring disease spread, among many others.

GS-24 - Citizen Science with GIS&T

Figure 1. Participant in a BioBlitz records bird observation (Source: Jo Somerfield)


Citizen Science is defined as the participation of non-professional volunteers in scientific projects (Dickson et al, 2010) and has experienced rapid growth over the past decade. The projects that are emerging in this area range from contributory projects, co-created projects, collegiate projects, which are initiated and run by a group of people with shared interest, without any involvement of professional scientists.  

In many citizen science projects, GIS&T is enabling the collection, analysis, and visualisation of spatial data to affect decision-making. Some examples may include:

  • Recording the location of invasive species or participating in a BioBlitz to record local biodiversity (Figure 1).
  • Measuring air quality or noise over a large area and over time to monitor local conditions and address them
  • Using tools to educate on and increase access to local resources,  improving community resilience

Such projects have the opportunity to empower or disempower members of the public, depending upon access to and understanding of technology. Citizen Science projects using GIS&T may help communities influence decision makers and support the gathering of large-scale scientific evidence on a range of issues. This may also renew people’s interests in the sciences and foster continued and lifelong learning. 


DM-14 - Classic vector data models
  • Illustrate the GBF/DIME data model
  • Describe a Freeman-Huffman chain code
  • Describe the relationship of Freeman-Huffman chain codes to the raster model
  • Discuss the impact of early prototype data models (e.g., POLYVRT and GBF/DIME) on contemporary vector formats
  • Describe the relationship between the GBF/DIME and TIGER structures, the rationale for their design, and their intended primary uses, paying particular attention to the role of graph theory in establishing the difference between GBF/DIME and TIGER files
  • Discuss the advantages and disadvantages of POLYVRT
  • Explain what makes POLYVRT a hierarchical vector data model
AM-09 - Cluster analysis
  • Identify several cluster detection techniques and discuss their limitations
  • Demonstrate the extension of spatial clustering to deal with clustering in space-time using the Know and Mantel tests
  • Perform a cluster detection analysis to detect “hot spots” in a point pattern
  • Discuss the characteristics of the various cluster detection techniques
GS-12 - Codes of ethics for geospatial professionals
  • Compare and contrast the ethical guidelines promoted by the GIS Certification Institute (GISCI) and the American Society for Photogrammetry and Remote Sensing (ASPRS)
  • Propose a resolution to a conflict between an obligation in the GIS Code of Ethics and organizations’ proprietary interests
  • Explain how one or more obligations in the GIS Code of Ethics may conflict with organizations’ proprietary interests
  • Describe the sanctions imposed by ASPRS and GISCI on individuals whose professional actions violate the codes of ethics
CV-09 - Color Theory
  • List the range of factors that should be considered in selecting colors
  • Discuss the role of “gamut” in choosing colors that can be reproduced on various devices and media
  • Explain how real-world connotations (e.g., blue=water, white=snow) can be used to determine color selections on maps
  • Exemplify colors for different forms of harmony, concordance, and balance
  • Estimate RGB (red, green, blue) primary amounts in a selection of colors
  • Plan color proofing suited for checking a map publication job
  • Select colors appropriate for map readers with color limitations
  • Specify a set of colors in device-independent Commision Internationale de L’Eclairage (CIE) specifications
  • Determine the CMYK (cyan, magenta, yellow, and black) primary amounts in a selection of colors
  • Select a color scheme (e.g., qualitative, sequential, diverging, spectral) that is appropriate for a given map purpose and variable
  • Describe how cultural differences with respect to color associations impact map design
  • Describe the common color models used in mapping
  • Describe color decisions made for various production workflows
PD-12 - Commercialization of GIS Applications

The commercialization of GIS applications refers to the process of bringing a software solution to market. The process involves three broad categories of tasks: identifying a problem or aspect of a problem that a GIS application can solve or address; designing and creating a GIS application to address the problem; and developing and executing a marketing plan to reach those with the problem, the potential users. Ideally these categories would be addressed in this order, but in practice, aspects of each are likely to be addressed and iterated throughout the commercialization process.

Bringing a GIS application to market requires expertise in 1) the target industry or market (e.g., forestry); 2) software development (how to design and build a product); 3) law (licenses, contracts, taxes); and 4) business (how to fund development, guide the process, evaluate success, marketing). A single individual or organization, referred to as the provider in this discussion, may lead or execute all three categories of tasks, or engage third parties when specific expertise is required.

CV-11 - Common Thematic Map Types
  • Describe the design considerations for each of the following methods: choropleth, dasymetric, proportioned symbol, graduated symbol, isoline, dot, cartogram, and flow map
  • Evaluate the strengths and limitations of each of the following methods: choropleth, dasymetric, proportioned symbol, graduated symbol, isoline, dot, cartogram, and flow map
  • Explain why choropleth maps should (almost) never be used for mapping count data and suggest alternative methods for mapping count data
  • Choose suitable mapping methods for each attribute of a given type of feature in a GIS (e.g., roads with various attributes such as surface type, traffic flow, number of lanes, direction such as one-way)
  • Select base information suited to providing a frame of reference for thematic map symbols (e.g., network of major roads and state boundaries underlying national population map)
  • Create maps using each of the following methods: choropleth, dasymetric, proportioned symbol, graduated symbol, isoline, dot, cartogram, and flow
  • Create well-designed legends using the appropriate conventions for the following methods: choropleth, dasymetric, proportioned symbol, graduated symbol, isoline, dot, cartogram, and flow
GS-17 - Common-sense geographies
  • Identify common-sense views of geographic phenomena that sharply contrast with established theories and technologies of geographic information
  • Differentiate applications that can make use of common-sense principles of geography from those that should not
  • Collaborate with non-GIS experts who use GIS to design applications that match commonsense understanding to an appropriate degree
  • Effectively communicate the design, procedures, and results of GIS projects to non-GIS audiences (clients, managers, general public)
  • Evaluate the impact of geospatial technologies (e.g., Google Earth) that allow non-geospatial professionals to create, distribute, and map geographic information

Pages