2019 QUARTER 01

A B C D E F G H I K L M N O P R S T U V W
CV-12 - Bivariate and Multivariate Maps
  • Differentiate the interpretation of a series of three maps and a single multivariate map, each representing the same three related variables
  • Design a single map symbol that can be used to symbolize a set of related variables
  • Create a map that displays related variables using different mapping methods (e.g., choropleth
  • and proportional symbol, choropleth and cartogram) Create a map that displays related variables using the same mapping method (e.g., bivariate choropleth map, bivariate dot map)
  • Design a map series to show the change in a geographic pattern over time
  • Detect a multivariate outlier using a combination of maps and graphs
  • Explain the relationship among several variables in a parallel coordinate plot
KE-20 - Budgeting for GIS management
  • Describe various approaches to the long-term funding of a GIS in an organization
  • Describe methods to evaluate the return on investment (ROI) of a GIS within an organization
  • Develop a budget for ongoing re-design and system improvement
  • Discuss the advantages and disadvantages of maintenance contracts for software, hardware, and data across an enterprise
  • Evaluate the adequacy of current investments in capital (e.g., facilities, hardware, software) and labor for a GIS
  • Justify changes to the investment in an enterprise GIS, including both cutbacks and increased expenses
AM-03 - Buffers

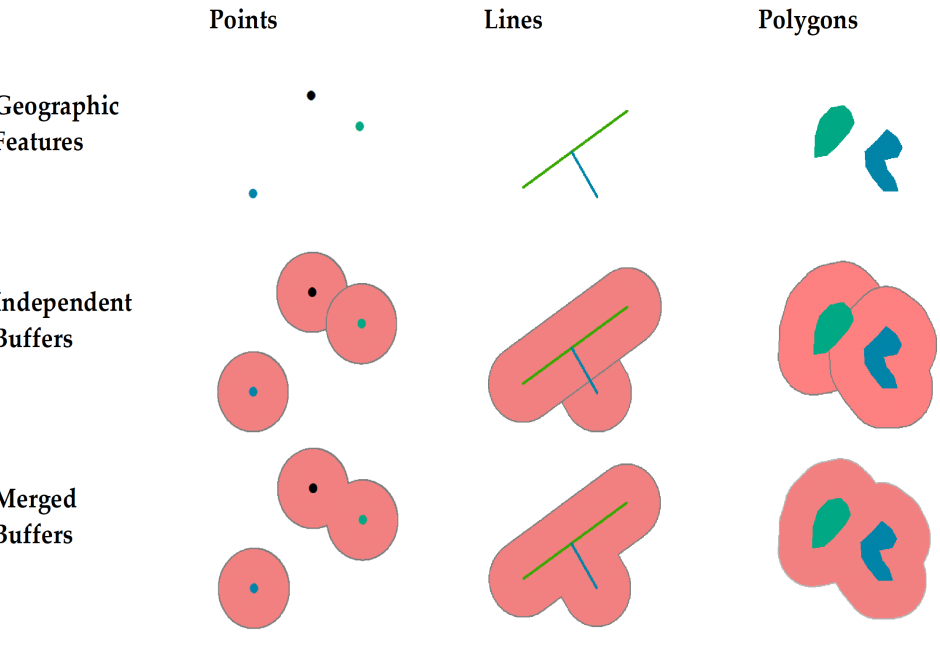
This short article introduces the definition of buffer and explains how buffers are created for single or multiple geographic features of different geometric types. It also discusses how buffers are generated differently in vector and raster data models and based on the concept of cost.

AM-15 - Calculating surface derivatives
  • List the likely sources of error in slope and aspect maps derived from digital elevation models (DEMs) and state the circumstances under which these can be very severe
  • Outline how higher order derivatives of height can be interpreted
  • Explain how slope and aspect can be represented as the vector field given by the first derivative of height
  • Explain why the properties of spatial continuity are characteristic of spatial surfaces
  • Explain why zero slopes are indicative of surface specific points such as peaks, pits, and passes, and list the conditions necessary for each
  • Design an algorithm that calculates slope and aspect from a triangulated irregular network (TIN) model
  • Outline a number of different methods for calculating slope from a DEM
KE-10 - Capital: facilities and equipment
  • Identify the hardware and space that will be needed for a GIS implementation
  • Compare and contrast the relative merits of housing GISs within IT (information technology) and MIS (management information system) facilities versus keeping them separate
  • Collaborate effectively with various units in an institution to develop efficient hardware and space solutions
  • Hypothesize the ways in which capital needs for GIS may change in the future
AM-80 - Capturing Spatiotemporal Dynamics in Computational Modeling

We live in a dynamic world that includes various types of changes at different locations over time in natural environments as well as in human societies. Modern sensing technology, location-aware technology and mobile technology have made it feasible to collect spatiotemporal tracking data at a high spatial and temporal granularity and at affordable costs. Coupled with powerful information and communication technologies, we now have much better data and computing platforms to pursue computational modeling of spatiotemporal dynamics. Researchers have attempted to better understand various kinds of spatiotemporal dynamics in order to predict, or even control, future changes of certain phenomena. A simple approach to representing spatiotemporal dynamics is by adding time (t) to the spatial dimensions (x,y,z) of each feature. However, spatiotemporal dynamics in the real world are more complex than a simple representation of (x,y,z,t) that describes the location of a feature at a given time. This article presents selected concepts, computational modeling approaches, and sample applications that provide a foundation to computational modeling of spatiotemporal dynamics. We also indicate why the research of spatiotemporal dynamics is important to geographic information systems (GIS) and geographic information science (GIScience), especially from a temporal GIS perspective.

CV-32 - Cartograms

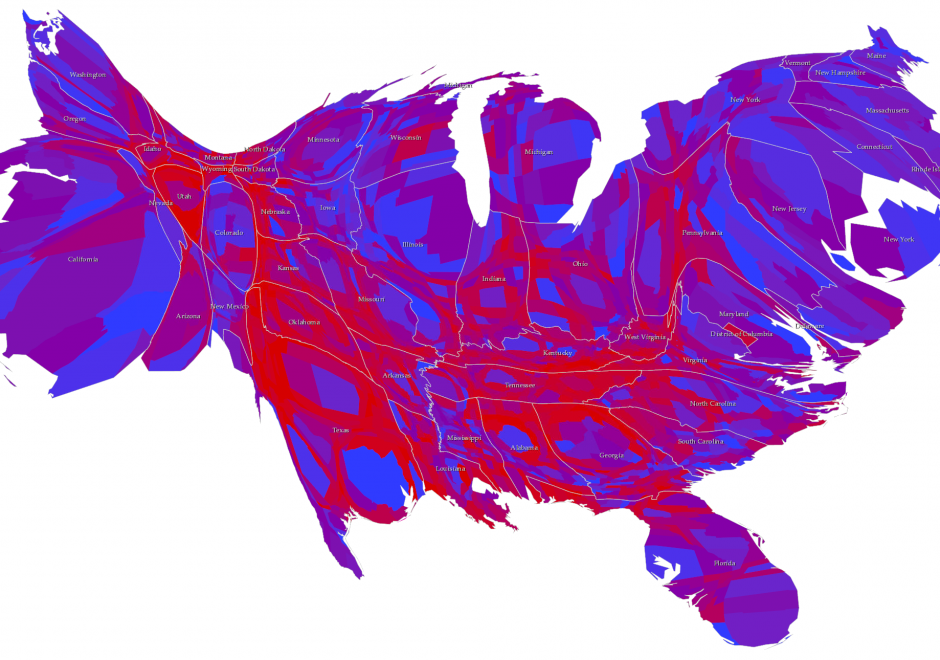
Cartograms are used for thematic mapping. They are a particular class of map type where some aspect of the geometry of the map is modified to accommodate the problem caused by perceptually different geographies. Standard thematic maps, such as the choropleth, have inherent biases simply due to the fact that areas will likely be very different in size from one another. The tendency to see larger areas as more important, regardless of the variable being mapped, can cause confusion. Cartograms tackle this by modifying the geography, effectively normalizing it to create a map where each area takes on a new shape and/or size based on the variable being mapped. Cartograms therefore depict geographical space diagrammatically as they lose their relationship with true coordinate system geometry. There are four main types of cartogram which each represent the mapped variable differently – non-contiguous, contiguous, graphical and gridded.  

AM-12 - Cartographic modeling
  • Describe the difference between prescriptive and descriptive cartographic models
  • Develop a flowchart of a cartographic model for a site suitability problem
  • Discuss the origins of cartographic modeling with reference to the work of Ian McHarg
CV-27 - Cartography and Art

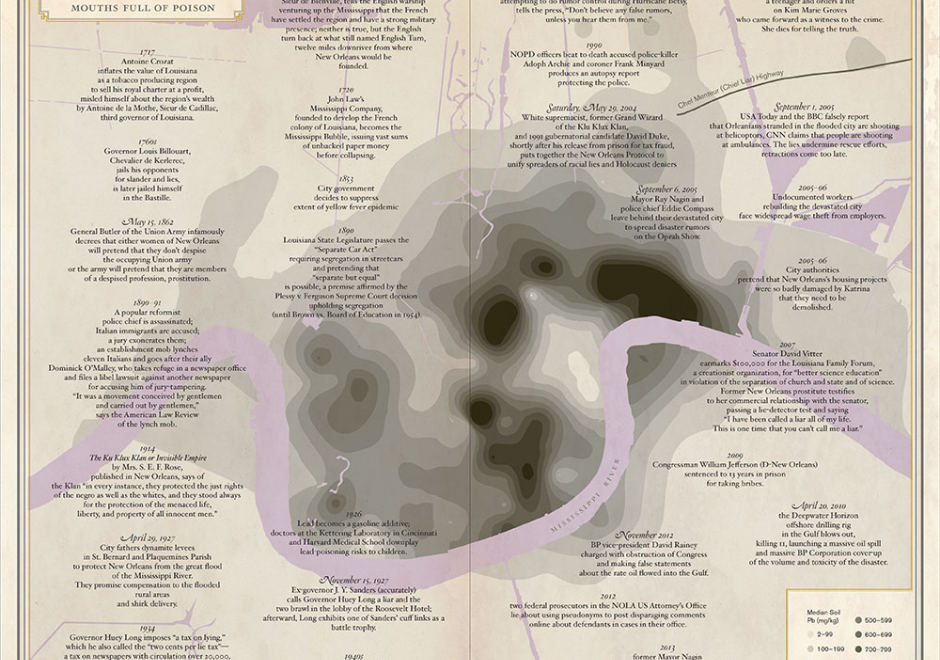
The intersections between art and cartography go far beyond the notions of design and illustration, since mapmaking invariably has multiple cultural, social, and political dimensions. Considering this broader perspective, this entry provides a review of these different contemporary intersections, by exploring three main types of relationships: 1) cartography influenced by artistic practices; 2) map art or maps embedded in artistic practices; and 3) cartography at the interface between art and places. These will be discussed in detail following a brief overview of the main historical markers from which these types of relationships between art and cartography have emerged.

CV-26 - Cartography and Power

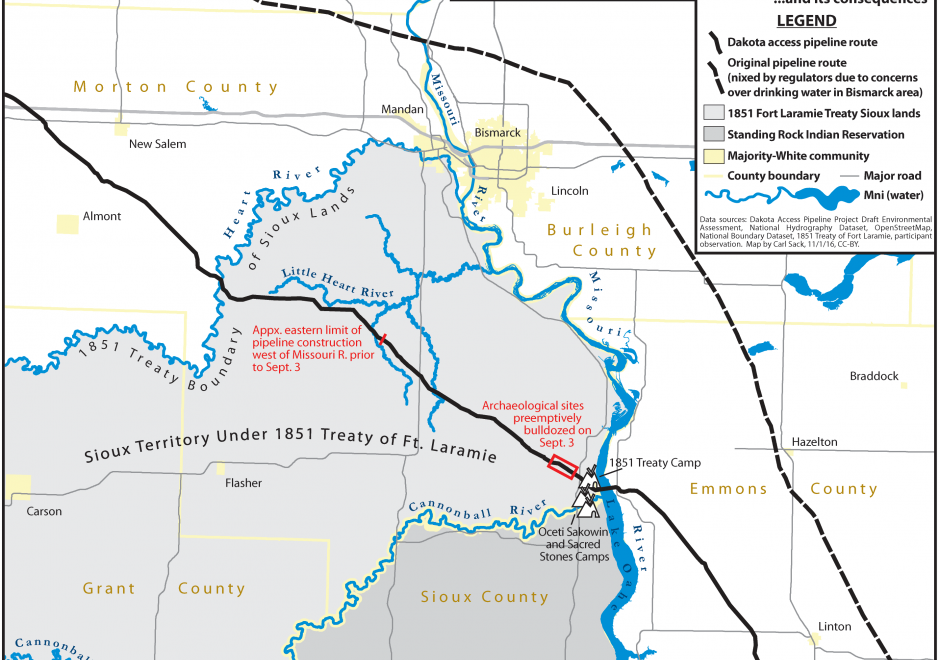
Over twenty five years ago, Brian Harley (1989, p. 2) implored cartographers to “search for the social forces that have structured cartography and to locate the presence of power – and its effects – in all map knowledge.” In the intervening years, while Harley has become a bit of a touchstone for citational practices acknowledging critical cartography (Edney, 2015), both theoretical understandings of power as well as the tools and technologies that go into cartographic production have changed drastically. This entry charts some of the many ways that power may be understood to manifest within and through maps and mapmaking practices. To do so, after briefly situating work on cartography and power historically, it presents six critiques of cartography and power in the form of dialectics. First, building from Harley’s earlier work, it defines a deconstructivist approach to mapping and places it in contrast to hermeneutic phenomenological approaches. Second, it places state-sanctioned practices of mapping against participatory and counter-mapping ones. Third, epistemological understanding of maps and their affects are explored through the dialectic of the map as a static object versus more processual, ontogenetic understandings of maps. Finally, the chapter concludes by suggesting the incomplete, heuristic nature of both the approaches and ideas explored here as well as the practices of critical cartography itself. Additional resources for cartographers and GIScientists seeking to further explore critical approaches to maps are provided.

Pages