2019 QUARTER 03

A B C D E F G H I K L M N O P R S T U V W
PD-15 - R for Geospatial Analysis and Mapping

R is a programming language as well as a computing environment to perform a wide variety of data analysis, statistics, and visualization. One of the reasons for the popularity of R is that it embraces open, transparent scholarship and reproducible research. It is possible to combine content and code in one document, so data, analysis, and graphs are tied together into one narrative, which can be shared with others to recreate analyses and reevaluate interpretations. Different from tools like ArcGIS or QGIS that are specifically built for spatial data, GIS functionality is just one of many things R offers. And while users of dedicated GIS tools typically interact with the software via a point-and-click graphical interface, R requires command-line scripting. Many R users today rely on RStudio, an integrated development environment (IDE) that facilitates the writing of R code and comes with a series of convenient features, like integrated help, data viewer, code completion, and syntax coloring. By using R Markdown, a particular flavor of the Markdown language, RStudio also makes it particularly easy to create documents that embed and execute R code snippets within a text and to render both, static documents (like PDF), as well as interactive html pages, a feature particularly useful for exploratory GIS work and mapping.

CV-20 - Raster Formats and Sources
  • Explain how color fastness and color consistency are ensured in map production
  • Compare outputs of the same map at various low and high resolutions
  • Differentiate among the various raster map outputs (JPEG, GIF, TIFF) and various vector formats (PDF, Adobe Illustrator Postscript)
  • Compare and contrast the file formats suited to presentation of maps on the Web to those suited to publication in high resolution contexts
  • Compare and contrast the issues that arise for map production using black-and-white and fourcolor process specifications
  • Outline the process for the digital production of offset press printed maps, including reference to feature and color separates, feature and map composites, and resolution
  • Critique typographic integrity in export formats (e.g., some file export processes break type into letters degrading searchability, font processing, and reliability of Raster Image Processing)
  • Prepare a map file for CMYK publication in a book
  • Prepare a map file for RGB presentation on a Web site
  • Discuss the purpose of advanced production methods (e.g., stochastic screening, hexachrome color, color management and device profiles, trapping, overprinting)
AM-60 - Raster resampling
  • Evaluate methods used by contemporary GIS software to resample raster data on-the-fly during display
  • Select appropriate interpolation techniques to resample particular types of values in raster data (e.g., nominal using nearest neighbor)
  • Resample multiple raster data sets to a single resolution to enable overlay
  • Resample raster data sets (e.g., terrain, satellite imagery) to a resolution appropriate for a map of a particular scale
  • Discuss the consequences of increasing and decreasing resolution
DM-03 - Relational DBMS
  • Explain the advantage of the relational model over earlier database structures including spreadsheets
  • Define the basic terms used in relational database management systems (e.g., tuple, relation, foreign key, SQL, relational join)
  • Discuss the efficiency and costs of normalization
  • Describe the entity-relationship diagram approach to data modeling
  • Explain how entity-relationship diagrams are translated into relational tables
  • Create an SQL query that extracts data from related tables
  • Describe the problems associated with failure to follow the first and second normal forms (including data confusion, redundancy, and retrieval difficulties)
  • Demonstrate how search and relational join operations provide results for a typical GIS query and other simple operations using the relational DBMS within a GIS software application
FC-09 - Relationships between space and time
  • Discuss common prepositions and adjectives (in any particular language) that signify either spatial or temporal relations but are used for both kinds, such as “after” or “longer”
  • Describe different types of movement and change
  • Understand the physical notions of velocity and acceleration which are fundamentally about movement across space through time
  • Identify various types of geographic interactions in space and time
  • Compare and contrast the characteristics of spatial and temporal dimensions
DC-26 - Remote Sensing Platforms

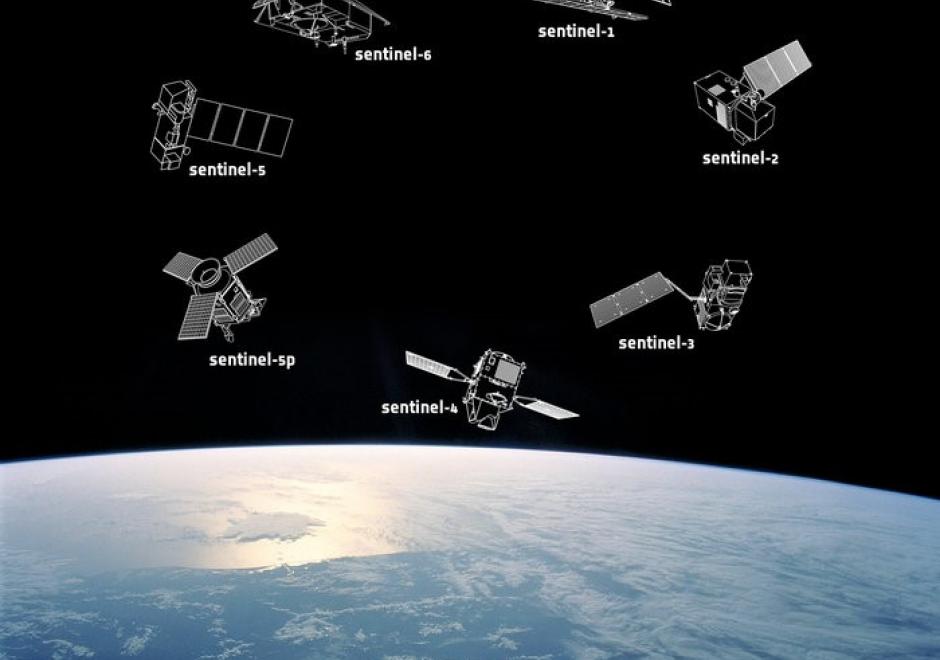
Remote sensing means acquiring and measuring information about an object or phenomenon via a device that is not in physical or direct contact with what is being studied (Colwell, 1983).To collect remotely sensed data, a platform – an instrument that carries a remote sensing sensor – is deployed. From the mid 1800’s to the early 1900’s, various platforms such as balloons, kites, and pigeons carried mounted cameras to collect visual data of the world below. Today, aircraft (both manned and unmanned) and satellites collect the majority of remotely sensed data. The sensors typically deployed on these platforms include film and digital cameras, light-detection and ranging (LiDAR) systems, synthetic aperture radar (SAR) systems, and multi-spectral and hyper-spectral scanners. Many of these instruments can be mounted on land-based platforms, such as vans, trucks, tractors, and tanks. In this chapter, we will explore the different types of platforms and their resulting remote sensing applications.

CV-18 - Representing Uncertainty

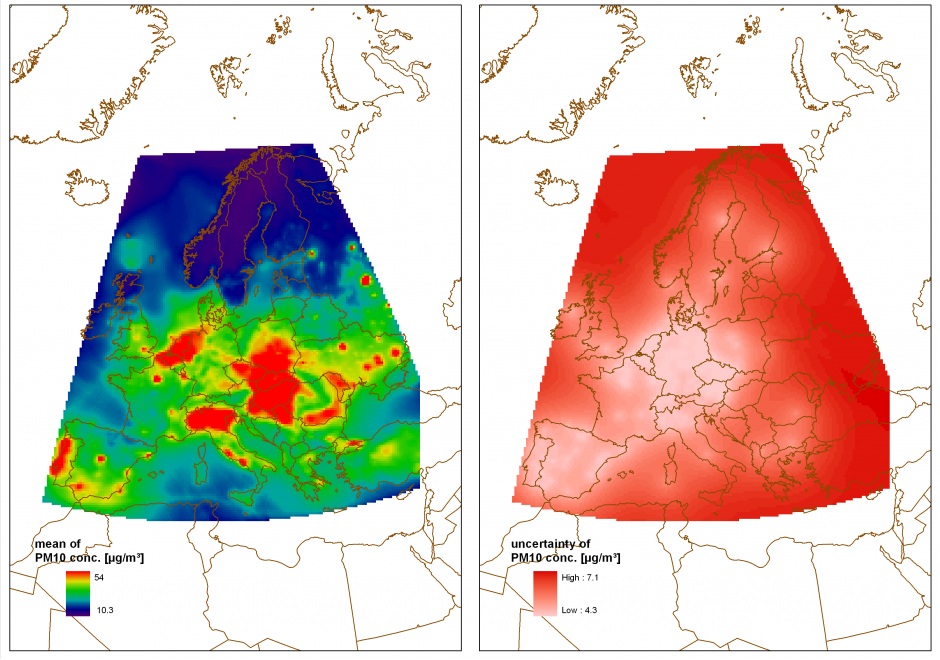
Using geospatial data involves numerous uncertainties stemming from various sources such as inaccurate or erroneous measurements, inherent ambiguity of the described phenomena, or subjectivity of human interpretation. If the uncertain nature of the data is not represented, ill-informed interpretations and decisions can be the consequence. Accordingly, there has been significant research activity describing and visualizing uncertainty in data rather than ignoring it. Multiple typologies have been proposed to identify and quantify relevant types of uncertainty and a multitude of techniques to visualize uncertainty have been developed. However, the use of such techniques in practice is still rare because standardized methods and guidelines are few and largely untested. This contribution provides an introduction to the conceptualization and representation of uncertainty in geospatial data, focusing on strategies for the selection of suitable representation and visualization techniques.

KE-05 - Requirements analysis
  • Describe the need for user-centered requirements analysis
  • Create requirements reports for individual potential applications in terms of the data, procedures, and output needed
  • Assess the relative importance and immediacy of potential applications
  • Synthesize the needs of individual users and tasks into enterprise-wide needs
  • Differentiate between the responsibilities of the proposed system and those that remain with the user
  • Illustrate how a business process analysis can be used to identify requirements during a GIS implementation
  • Describe how spatial data and GIS&T can be integrated into a workflow process
  • Evaluate how external spatial data sources can be incorporated into the business process
  • Develop use cases for potential applications using established techniques with potential users, such as questionnaires, interviews, focus groups, the Delphi method, and/or joint application development (JAD)
  • Document existing and potential tasks in terms of workflow and information flow
FC-21 - Resolution

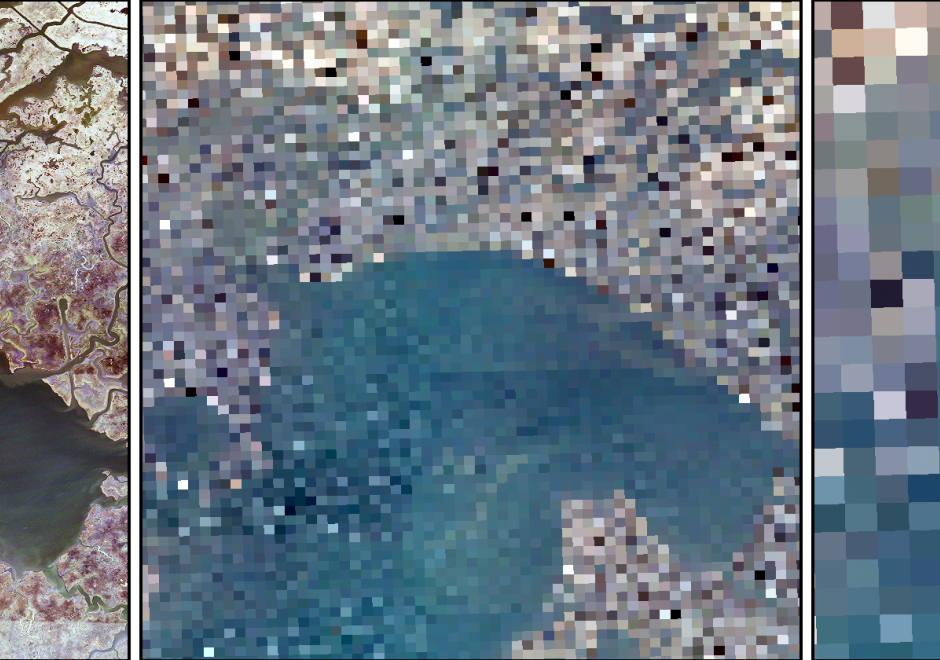
Resolution in the spatial domain refers to the size of the smallest measurement unit observed or recorded for an object, such as pixels in a remote sensing image or line segments used to record a curve. Resolution, also called the measurement scale, is considered one of the four major dimensions of scale, along with the operational scale, observational scale, and cartographic scale. Like the broader concept of scale, resolution is a fundamental consideration in GIScience because it affects the reliability of a study and contributes to the uncertainties of the findings and conclusions. While resolution effects may never be eliminated, techniques such as fractals could be used to reveal the multi-resolution property of a phenomenon and help guide the selection of resolution level for a study.

AM-68 - Rule Learning for Spatial Data Mining

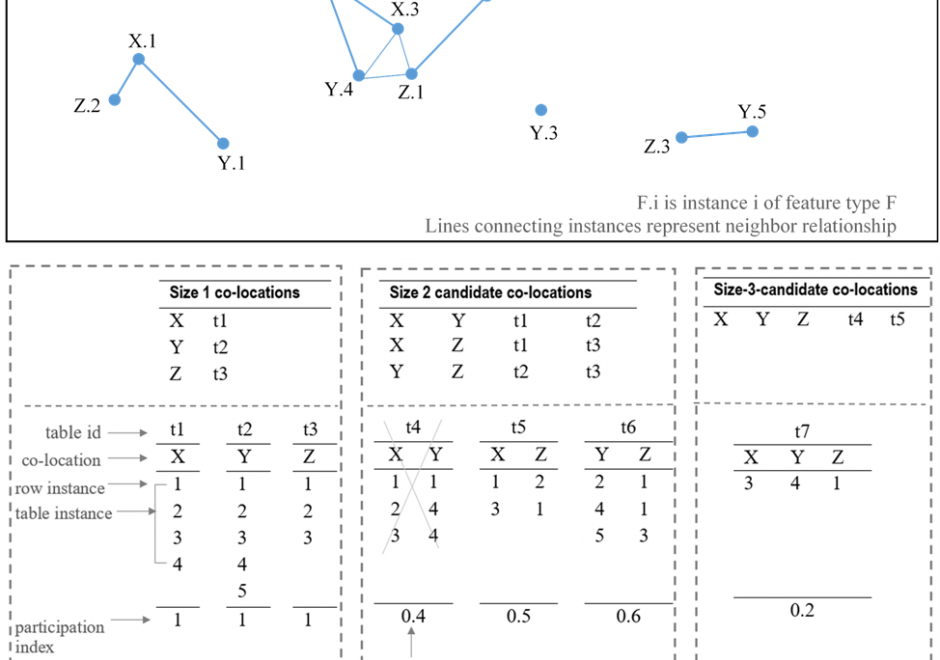
Recent research has identified rule learning as a promising technique for geographic pattern mining and knowledge discovery to make sense of the big spatial data avalanche (Koperski & Han, 1995; Shekhar et al., 2003). Rules conveying associative implications regarding locations, as well as semantic and spatial characteristics of analyzed spatial features, are especially of interest. This overview considers fundamentals and recent advancements in two approaches applied on spatial data: spatial association rule learning and co-location rule learning.