2019 QUARTER 03

A B C D E F G H I K L M N O P R S T U V W
AM-46 - Location-allocation modeling

Location-allocation models involve two principal elements: 1) multiple facility location; and 2) the allocation of the services or products provided by those facilities to places of demand. Such models are used in the design of logistic systems like supply chains, especially warehouse and factory location, as well as in the location of public services. Public service location models involve objectives that often maximize access and levels of service, while private sector applications usually attempt to minimize cost. Such models are often hard to solve and involve the use of integer-linear programming software or sophisticated heuristics. Some models can be solved with functionality provided in GIS packages and other models are applied, loosely coupled, with GIS. We provide a short description of formulating two different models as well as discuss how they are solved.

CP-12 - Location-Based Services
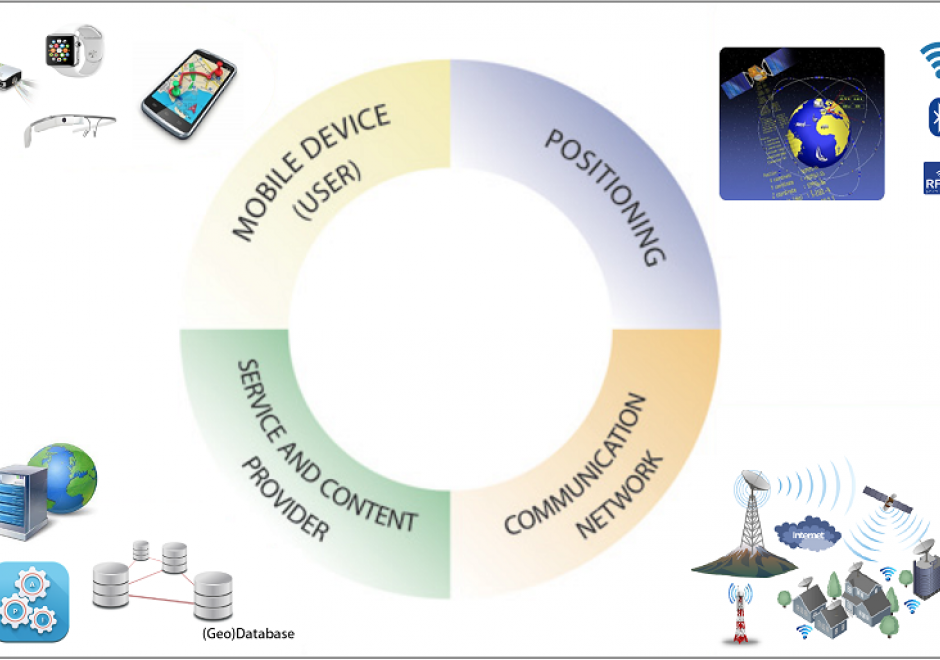
Location-Based Services (LBS) are mobile applications that provide information depending on the location of the user. To make LBS work, different system components are needed, i.e., mobile devices, positioning, communication networks, and service and content provider. Almost every LBS application needs several key elements to handle the main tasks of positioning, data modeling, and information communication. With the rapid advances in mobile information technologies, LBS have become ubiquitous in our daily lives with many application fields, such as navigation and routing, social networking, entertainment, and healthcare. Several challenges also exist in the domain of LBS, among which privacy is a primary one. This topic introduces the key components and technologies, modeling, communication, applications, and the challenges of LBS.

DM-35 - Logical Data Models

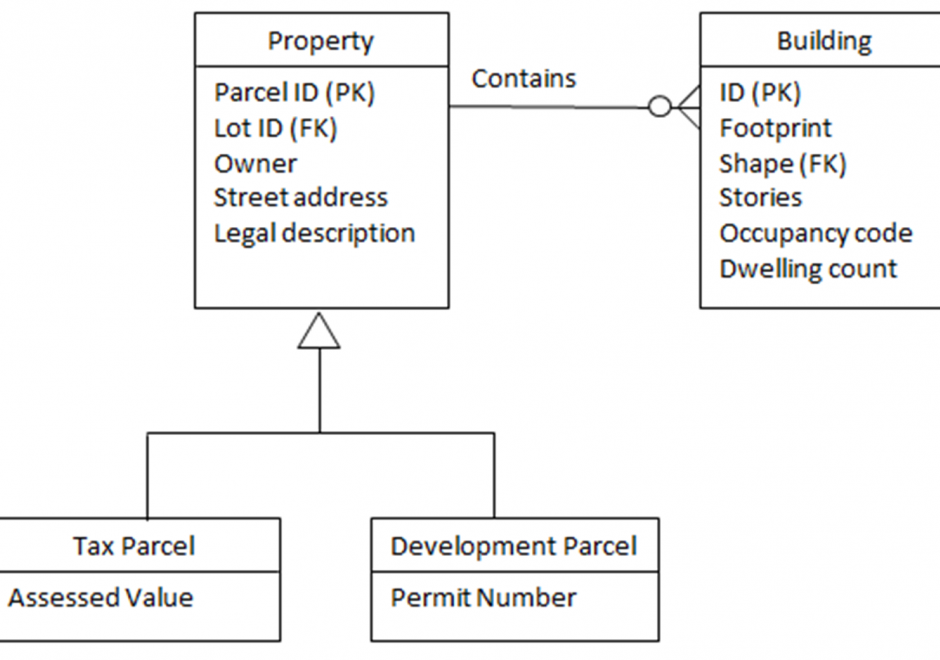
A logical data model is created for the second of three levels of abstraction, conceptual, logical, and physical. A logical data model expresses the meaning context of a conceptual data model, and adds to that detail about data (base) structures, e.g. using topologically-organized records, relational tables, object-oriented classes, or extensible markup language (XML) construct  tags. However, the logical data model formed is independent of a particular database management software product. Nonetheless such a model is often constrained by a class of software language techniques for representation, making implementation with a physical data model easier. Complex entity types of the conceptual data model must be translated into sub-type/super-type hierarchies to clarify data contexts for the entity type, while avoiding duplication of concepts and data. Entities and records should have internal identifiers. Relationships can be used to express the involvement of entity types with activities or associations. A logical schema is formed from the above data organization. A schema diagram depicts the entity, attribute and relationship detail for each application. The resulting logical data models can be synthesized using schema integration to support multi-user database environments, e.g., data warehouses for strategic applications and/or federated databases for tactical/operational business applications.

KE-19 - Managing GIS operations and infrastructure
  • Calculate the estimated schedule required to carry out all of the implementation steps for an enterprise GIS of a given size
  • List some of the topics that should be addressed in a justification for implementing an enterprise GIS (e.g., return on investment, workflow, knowledge sharing)
  • Indicate the possible justifications that can be used to implement an enterprise GIS
  • Exemplify each component of a needs assessment for an enterprise GIS
  • Describe the components of a needs assessment for an enterprise GIS
AM-06 - Map algebra
  • Explain the categories of map algebra operations (i.e., local, focal, zonal, and global functions)
  • Explain why georegistration is a precondition to map algebra
  • Differentiate between map algebra and matrix algebra using real examples
  • Perform a map algebra calculation using command line, form-based, and flow charting user interfaces
  • Describe a real modeling situation in which map algebra would be used (e.g., site selection, climate classification, least-cost path)
  • Describe how map algebra performs mathematical functions on raster grids
CV-23 - Map analysis
  • Create a profile of a cross section through a terrain using a topographic map and a digital elevation model (DEM)
  • Measure point-feature movement and point-feature diffusion on maps
  • Describe maps that can be used to find direction, distance, or position, plan routes, calculate area or volume, or describe shape
  • Explain how maps can be used in determining an optimal route or facility selection
  • Explain how maps can be used in terrain analysis (e.g., elevation determination, surface profiles, slope, viewsheds, and gradient)
  • Explain how the types of distortion indicated by projection metadata on a map will affect map measurements
  • Explain the differences between true north, magnetic north, and grid north directional references
  • Compare and contrast the manual measurement of the areas of polygons on a map printed from a GIS with those calculated by the computer and discuss the implications these variations in measurement might have on map use
  • Determine feature counts of point, line, and area features on maps
  • Analyze spatial patterns of selected point, line, and area feature arrangements on maps
  • Calculate slope using a topographic map and a DEM
  • Calculate the planimetric and actual road distances between two locations on a topographic map
  • Plan an orienteering tour of a specific length that traverses slopes of an appropriate steepness and crosses streams in places that can be forded based on a topographic map
  • Describe the differences between azimuths, bearings, and other systems for indicating directions
CV-22 - Map interpretation
  • Identify the landforms represented by specific patterns in contours on a topographic map
  • Hypothesize about geographic processes by synthesizing the patterns found on one or more thematic maps or data visualizations
  • Match features on a map to corresponding features in the world
  • Compare and contrast the interpretation of landscape, geomorphic features, and human settlement types shown on a series of topographic maps from several different countries
CV-30 - Map Production and Management

Map production describes the experience of managing the many aspects and details of map creation. Often the map product is created for someone else—a client, supervisor, or instructor. Describing the intention of the map and evaluating available resources ahead of the project can help the cartographer define content requirements, stay on task, and ultimately meet deadlines. The project management life cycle involves clear communication between the cartographer and client, with resolutions to common questions best addressed at the beginning of the project. The process then iteratively cycles through phases that include research and production, followed by quality control, and concludes with file preparation and delivery.

Pages