2019 QUARTER 04

A B C D E F G H I K L M N O P R S T U V W
CV-38 - Usability Engineering & Evaluation

In this entry, we introduce tenets of usability engineering (UE) and user-centered design (UCD), interrelated approaches to ensuring that a map or visualization works for the target use. After a general introduction to these concepts and processes, we then discuss treatment of UE and UCD in research on cartography and geographic visualization. Finally, we present a classification of UE evaluation methods, including a general overview of each category of method and their application to cartographic user research.  

CV-13 - User Interface and User Experience (UI/UX) Design
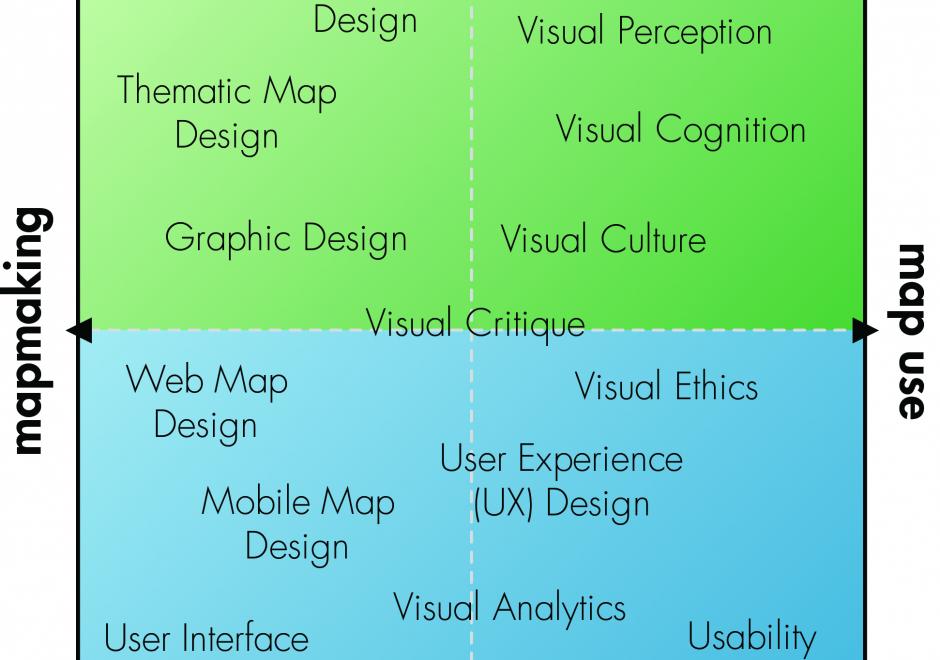
Advances in personal computing and information technologies have fundamentally transformed how maps are produced and consumed, as many maps today are highly interactive and delivered online or through mobile devices. Accordingly, we need to consider interaction as a fundamental complement to representation in cartography and visualization. UI (user interface) / UX (user experience) describes a set of concepts, guidelines, and workflows for critically thinking about the design and use of an interactive product, map or otherwise. This entry introduces core concepts from UI/UX design important to cartography and visualization, focusing on issues related to visual design. First, a fundamental distinction is made between the use of an interface as a tool and the broader experience of an interaction, a distinction that separates UI design and UX design. Norman’s stages of interaction framework then is summarized as a guiding model for understanding the user experience with interactive maps, noting how different UX design solutions can be applied to breakdowns at different stages of the interaction. Finally, three dimensions of UI design are described: the fundamental interaction operators that form the basic building blocks of an interface, interface styles that implement these operator primitives, and recommendations for visual design of an interface.

CV-24 - User-Centered Design and Evaluation
  • Describe the baseline expectations that a particular map makes of its audience
  • Compare and contrast the interpretive dangers (e.g., ecological fallacy, Modifiable Areal Unit Problem) that are inherent to different types of maps or visualizations and their underlying geographic data
  • Identify several uses for which a particular map is or is not effective
  • Identify the particular design choices that make a map more or less effective
  • Evaluate the effectiveness of a map for its audience and purpose
  • Design a testing protocol to evaluate the usability of a simple graphical user interface
  • Perform a rigorous sampled field check of the accuracy of a map
  • Discuss the use limitations of the USGS map accuracy standards for a range of projects demanding different levels of precision (e.g., driving directions vs. excavation planning)
DM-30 - Vagueness
  • Compare and contrast the meanings of related terms such as vague, fuzzy, imprecise, indefinite, indiscrete, unclear, and ambiguous
  • Describe the cognitive processes that tend to create vagueness
  • Recognize the degree to which vagueness depends on scale
  • Evaluate vagueness in the locations, time, attributes, and other aspects of geographic phenomena
  • Differentiate between the following concepts: vagueness and ambiguity, well defined and poorly defined objects and fields, and discord and non-specificity
  • Identify the hedges used in language to convey vagueness
  • Evaluate the role that system complexity, dynamic processes, and subjectivity play in the creation of vague phenomena and concepts
  • Differentiate applications in which vagueness is an acceptable trait from those in which it is unacceptable
KE-27 - Value of Professional Geospatial Organizations

There are a great many professional associations in the geospatial sector.  They provide a great deal of value to the geospatial community and professionals working in that community.  The value can be described in terms of professional development, technological and organizational advancement, advocacy, governance, and leadership.  The following text explains the various ways in which professional associations provide value to the community.

KE-14 - Valuing and measuring benefits
  • Distinguish between operational, organizational, and societal activities that rely upon geospatial information
  • Describe the potential benefits of geospatial information in terms of efficiency, effectiveness, and equity
  • Explain how cost-benefit analyses can be manipulated
  • Compare and contrast the evaluation of benefits at different scales (e.g., national, regional/state, local)
  • Identify practical problems in defining and measuring the value of geospatial information in land or other business decisions
DC-14 - Vector data extraction
  • Describe the source data, instrumentation, and workflow involved in extracting vector data (features and elevations) from analog and digital stereoimagery
  • Discuss future prospects for automated feature extraction from aerial imagery
  • Discuss the extent to which vector data extraction from aerial stereoimagery has been automated
CV-03 - Vector Formats and Sources

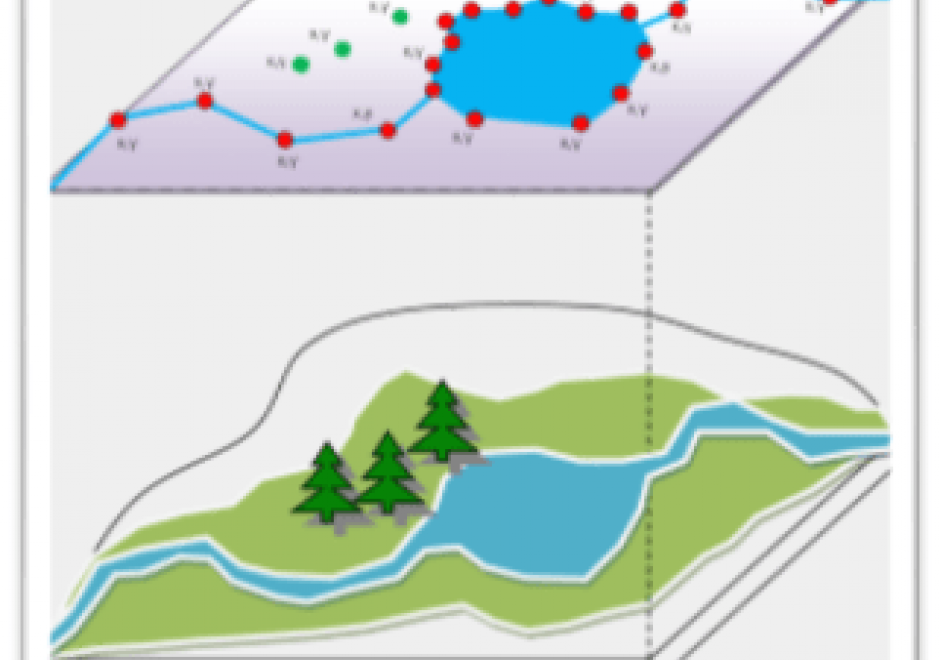
In the last ten years, the rise of efficient computing devices with significant processing power and storage has caused a surge in digital data collection and publication. As more software programs and hardware devices are released, we are not only seeing an increase in available data, but also an increase in available data formats. Cartographers today have access to a wide range of interesting datasets, and online portals for downloading geospatial data now frequently offer that data in several different formats. This chapter provides information useful to modern cartographers working with vector data, including an overview of common vector data formats (e.g. shapefile, GeoJSON, file geodatabase); their relative benefits, idiosyncrasies, and limitations; and a list of popular sources for geospatial vector data (e.g. United States Census Bureau, university data warehouses).

AM-59 - Vector-to-raster and raster-to-vector conversions
  • Explain how the vector/raster/vector conversion process of graphic images and algorithms takes place and how the results are achieved
  • Create estimated tessellated data sets from point samples or isolines using interpolation operations that are appropriate to the specific situation
  • Illustrate the impact of vector/raster/vector conversions on the quality of a dataset
  • Convert vector data to raster format and back using GIS software
DM-51 - Vertical datums
  • Explain how a vertical datum is established
  • Differentiate between NAVD 29 and NAVD 88
  • Illustrate the difference between a vertical datum and a geoid
  • Illustrate the relationship among the concepts ellipsoidal (or geodetic) height, geoidal height, and orthometric elevation
  • Outline the historical development of vertical datums

Pages