2020 QUARTER 02

A B C D E F G H I K L M N O P R S T U V W
AM-22 - Global Measures of Spatial Association

Spatial association broadly describes how the locations and values of samples or observations vary across space. Similarity in both the attribute values and locations of observations can be assessed using measures of spatial association based upon the first law of geography. In this entry, we focus on the measures of spatial autocorrelation that assess the degree of similarity between attribute values of nearby observations across the entire study region. These global measures assess spatial relationships with the combination of spatial proximity as captured in the spatial weights matrix and the attribute similarity as captured by variable covariance (i.e. Moran’s I) or squared difference (i.e. Geary’s C). For categorical data, the join count statistic provides a global measure of spatial association. Two visualization approaches for spatial autocorrelation measures include Moran scatterplots and variograms (also known as semi-variograms).

DC-03 - Global Positioning System
  • Explain how GPS receivers calculate coordinate data
  • Discuss the relationship of GPS to the Global Satellite Navigation System
  • Explain “selective availability,” why it was discontinued in 2000, and what alternatives are available to the U.S. Department of Defense
  • Explain the relationship of the U.S. Global Positioning System with comparable systems sponsored by Russia and the European Union and the Global Navigation Satellite System
  • Discuss the role of GPS in location-based services (LBS)
  • Specify the features of a GPS receiver that is able to achieve geometric accuracies on the order of centimeters without post-processing
  • Explain the relevance of the concept of trilateration to both GPS positioning and control surveying
  • Perform differential correction of GPS data using reference data from a CORS station
  • List, define, and rank the sources of error associated with GPS positioning
  • Distinguish between horizontal and vertical accuracies when using coarse acquisition codes/standard positioning service (C-codes) and precision acquisition codes/precise positioning service (P-codes)
CP-23 - Google Earth Engine

Google Earth Engine (GEE) is a cloud-based platform for planetary scale geospatial data analysis and communication.  By placing more than 17 petabytes of earth science data and the tools needed to access, filter, perform, and export analyses in the same easy to use application, users are able to explore and scale up analyses in both space and time without any of the hassles traditionally encountered with big data analysis.  Constant development and refinement have propelled GEE into one of the most advanced and accessible cloud-based geospatial analysis platforms available, and the near real time data ingestion and interface flexibility means users can go from observation to presentation in a single window.

PD-13 - GPU Programming for GIS Applications

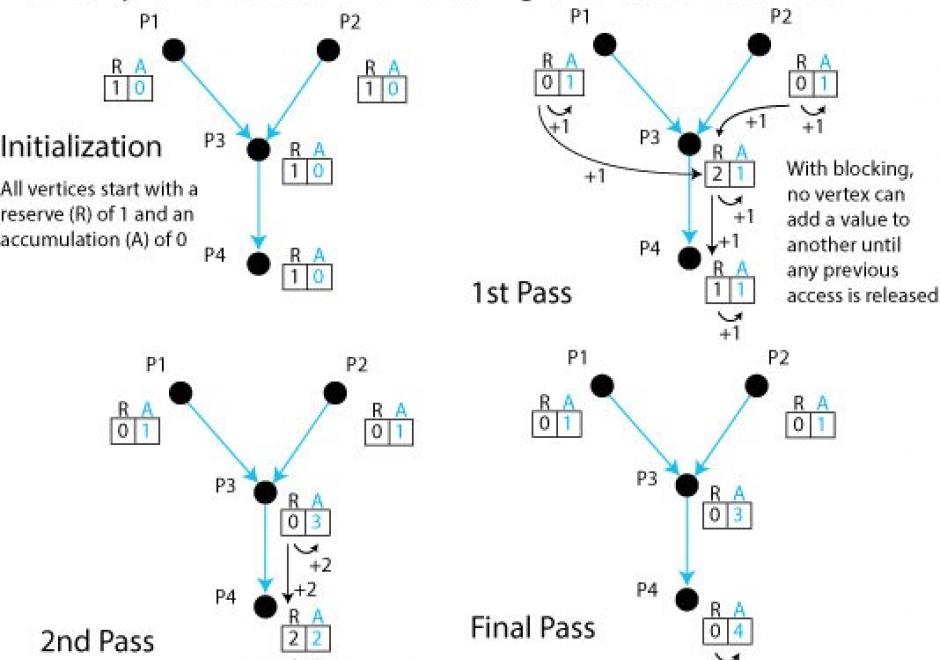
Graphics processing units (GPUs) are massively parallel computing environments with applications in graphics and general purpose programming. This entry describes GPU hardware, application domains, and both graphics and general purpose programming languages.

CP-06 - Graphics Processing Units (GPUs)

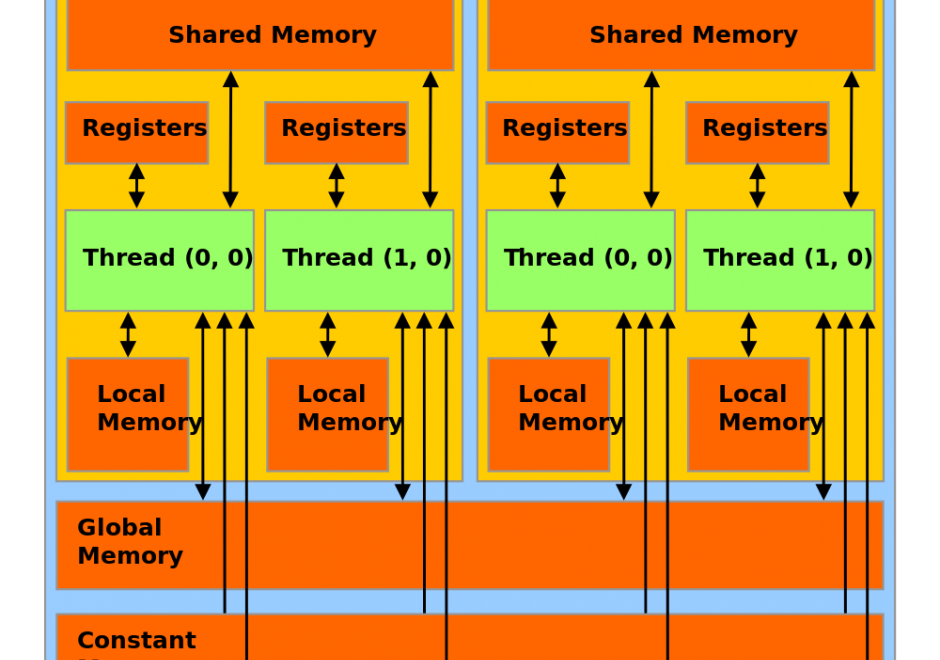
Graphics Processing Units (GPUs) represent a state-of-the-art acceleration technology for general-purpose computation. GPUs are based on many-core architecture that can deliver computing performance much higher than desktop computers based on Central Processing Units (CPUs). A typical GPU device may have hundreds or thousands of processing cores that work together for massively parallel computing. Basic hardware architecture and software standards that support the use of GPUs for general-purpose computation are illustrated by focusing on Nvidia GPUs and its software framework: CUDA. Many-core GPUs can be leveraged for the acceleration of spatial problem-solving.  

DC-19 - Ground Verification and Accuracy Assessment

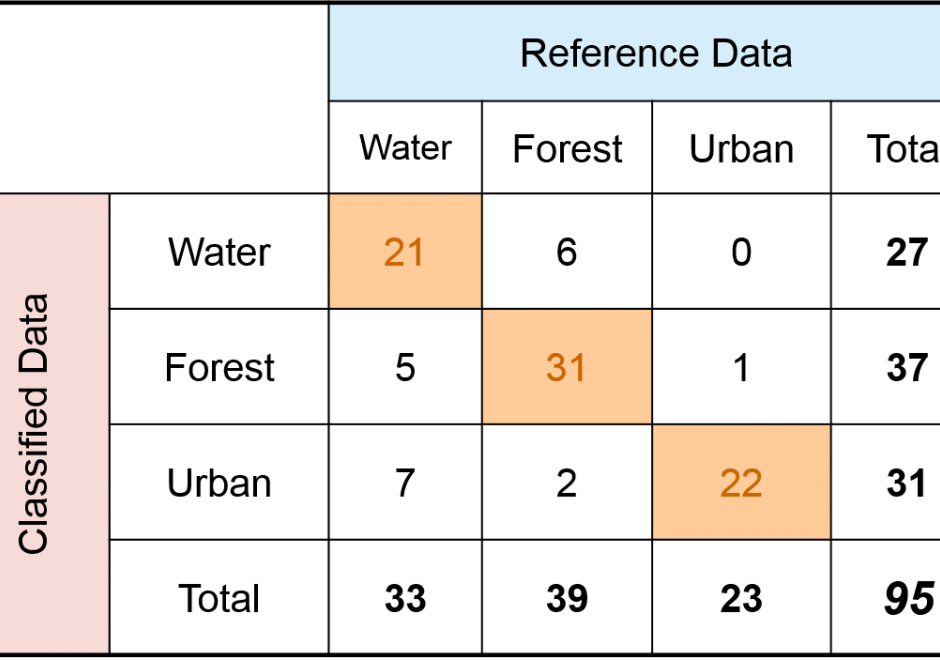
Spatial products such as maps of land cover, soil type, wildfire, glaciers, and surface water have become increasingly available and used in science and policy decisions.  These maps are not without error, and it is critical that a description of quality accompany each product.  In the case of a thematic map, one aspect of quality is obtained by conducting a spatially explicit accuracy assessment in which the map class and reference class are compared on a per spatial unit basis (e.g., per 30m x 30m pixel).  The outcome of an accuracy assessment is a description of quality of the end-product map, in contrast to conducting an evaluation of map quality as part of the map production process.  The accuracy results can be used to decide if the map is of adequate quality for an intended application, as input to uncertainty analyses, and as information to improve future map products.

DM-11 - Hierarchical data models
  • Illustrate the quadtree model
  • Describe the advantages and disadvantages of the quadtree model for geographic database representation and modeling
  • Describe alternatives to quadtrees for representing hierarchical tessellations (e.g., hextrees, rtrees, pyramids)
  • Explain how quadtrees and other hierarchical tessellations can be used to index large volumes of raster or vector data
  • Implement a format for encoding quadtrees in a data file
CP-03 - High performance computing
  • Describe how the power increase in desktop computing has expanded the analytic methods that can be used for GIS&T
  • Exemplify how the power increase in desktop computing has expanded the analytic methods that can be used for GIS&T
DC-36 - Historical Maps in GIS

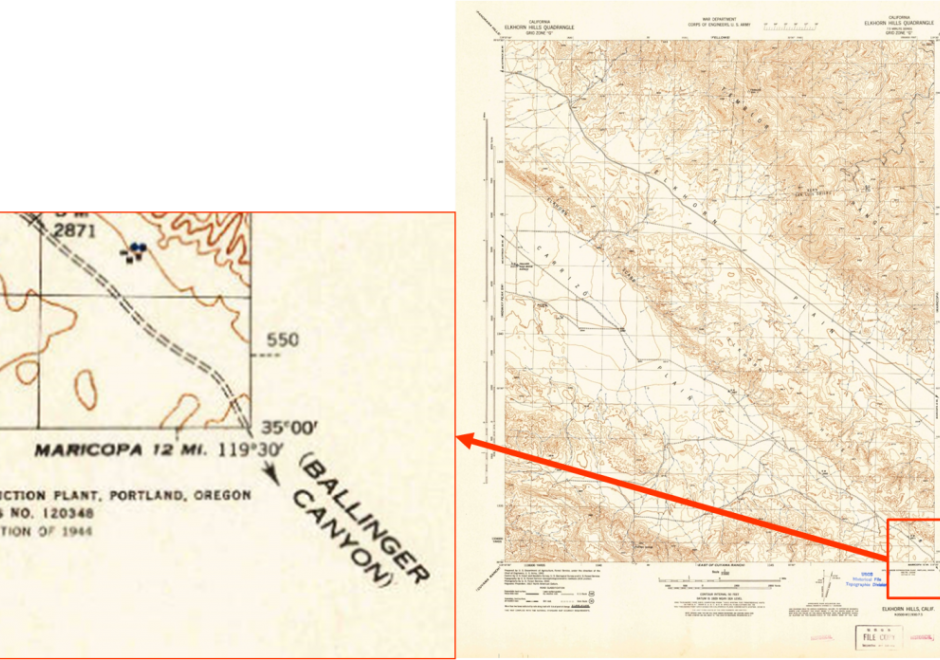
The use of historical maps in coordination with GIS aids scholars who are approaching a geographical study in which an historical approach is required or is interested in the geographical relationships between different historical representations of the landscape in cartographic document.  Historical maps allow the comparison of spatial relationships of past phenomena and their evolution over time and permit both qualitative and quantitative diachronic analysis. In this chapter, an explanation of the use of historical maps in GIS for the study of landscape and environment is offered. After a short theoretical introduction on the meaning of the term “historical map,” the reader will find the key steps in using historic maps in a GIS, a brief overview on the challenges in interpretation of historical maps, and some example applications.

DM-52 - Horizontal datums
  • Discuss appropriate applications of the various datum transformation options
  • Explain the difference between NAD 27 and NAD 83 in terms of ellipsoid parameters
  • Outline the historical development of horizontal datums
  • Explain the difference in coordinate specifications for the same position when referenced to NAD 27 and NAD 83
  • Explain the rationale for updating NAD 27 to NAD 83
  • Explain why all GPS data are originally referenced to the WGS 84 datum
  • Identify which datum transformation options are available and unavailable in a GIS software package
  • Define “horizontal datum” in terms of the relationship between a coordinate system and an approximation of the Earth’s surface
  • Describe the limitations of a Molodenski transformation and in what circumstances a higher parameter transformation such as Helmert may be appropriate
  • Determine the impact of a datum transformation from NAD 27 to NAD 83 for a given location using a conversion routine maintained by the U.S. National Geodetic Survey
  • Explain the methodology employed by the U.S. National Geodetic Survey to transform control points from NAD 27 to NAD 83
  • Perform a Molodenski transformation manually
  • Use GIS software to perform a datum transformation

Pages