2020 QUARTER 02

A B C D E F G H I K L M N O P R S T U V W
CV-12 - Multivariate Mapping

Bivariate and multivariate maps encode two or more data variables concurrently into a single symbolization mechanism. Their purpose is to reveal and communicate relationships between the variables that might not otherwise be apparent via a standard single-variable technique. These maps are inherently more complex, though offer a novel means of visualizing the nuances that may exist between the mapped variables. As information-dense visual products, they can require considerable effort on behalf of the map reader, though a thoughtfully-designed map and legend can be an interesting opportunity to effectively convey a comparative dimension.

This chapter describes some of the key types of bivariate and multivariate maps, walks through some of the rationale for various techniques, and encourages the reader to take an informed, balanced approach to map design weighing information density and visual complexity. Some alternatives to bivariate and multivariate mapping are provided, and their relative merits are discussed.

DC-16 - Nature of Multispectral Image Data
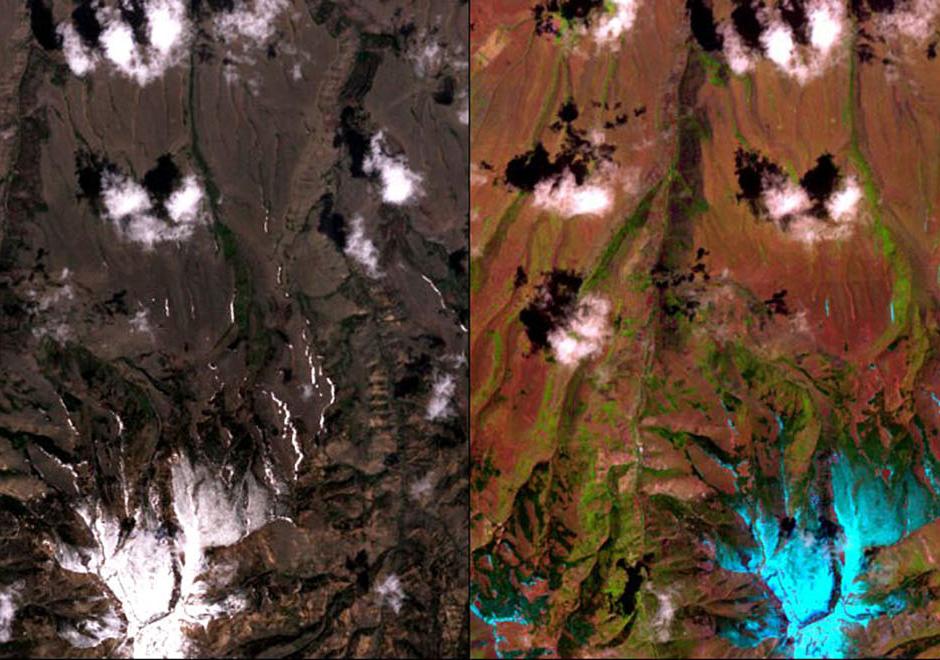
A multispectral image comprises a set of co-registered images, each of which captures the spatially varying brightness of a scene in a specific spectral band, or electromagnetic wavelength region. An image is structured as a raster, or grid, of pixels. Multispectral images are used as a visual backdrop for other GIS layers, to provide information that is manually interpreted from images, or to generate automatically-derived thematic layers, for example through classification. The scale of multispectral images has spatial, spectral, radiometric and temporal components. Each component of scale has two aspects, extent (or coverage), and grain (or resolution). The brightness variations of an image are determined by factors that include (1) illumination variations and effects of the atmosphere, (2) spectral properties of materials in the scene (particularly reflectance, but also, depending on the wavelength, emittance), (3) spectral bands of the sensor, and (4) display options, such as the contrast stretch, which affect the visualization of the image. This topic review focuses primarily on optical remote sensing in the visible, near infrared and shortwave infrared parts of the electromagnetic spectrum, with an emphasis on satellite imagery.  

AM-05 - Neighborhoods

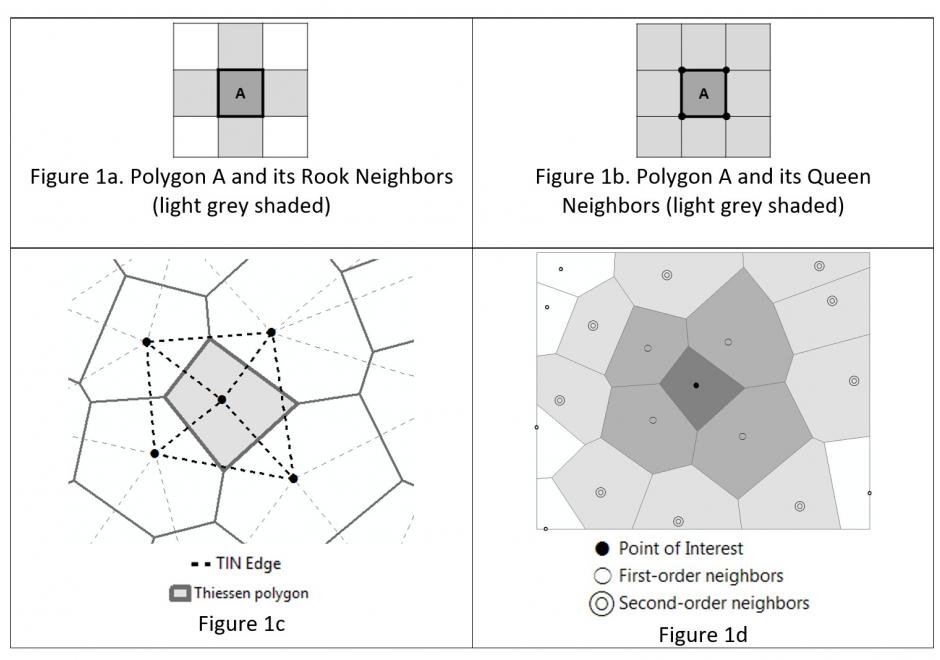
Neighborhoods mean different things in varied contexts like computational geometry, administration and planning, as well as urban geography and other fields. Among the multiple contexts, computational geometry takes the most abstract and data-oriented approach: polygon neighborhoods refer to polygons sharing a boundary or a point, and point neighborhoods are defined by connected Thiessen polygons or other more complicated algorithms. Neighborhoods in some regions can be a practical and clearly delineated administration or planning units. In urban geography and some related social sciences, the terms neighborhood and community have been used interchangeably on many occasions, and neighborhoods can be a fuzzy and general concept with no clear boundaries such that they cannot be easily or consensually defined. Neighborhood effects have a series of unique meanings and several delineation methods are commonly used to define social and environmental effects in health applications.

FC-19 - Networks Defined

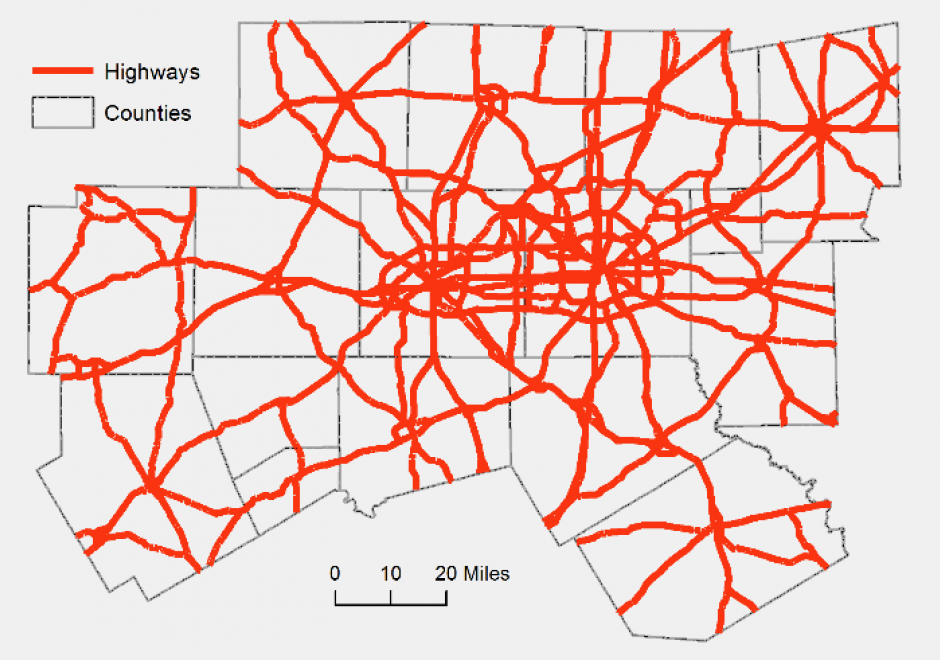
A network is a widely used term with different definitions and methodologies depending on the applications. In GIS, a network refers to an arrangement of elements (i.e., nodes, links) and information on their connections and interactions. There are two types of networks: physical and logical. While a physical network has tangible objects (e.g., road segments), a logical network represents logical connections among nodes and links. A network can be represented with a mathematical notion called graph theory. Different network components are utilized to describe characteristics of a network including loops, walks, paths, circuits, and parallel edges. Network data are commonly organized in a vector format with network topology, specifically connectivity among nodes and links, whereas raster data can be also utilized for a least-cost problem over continuous space. Network data is utilized in a wide range of network analyses, including the classic shortest path problem.

DM-67 - NoSQL Databases

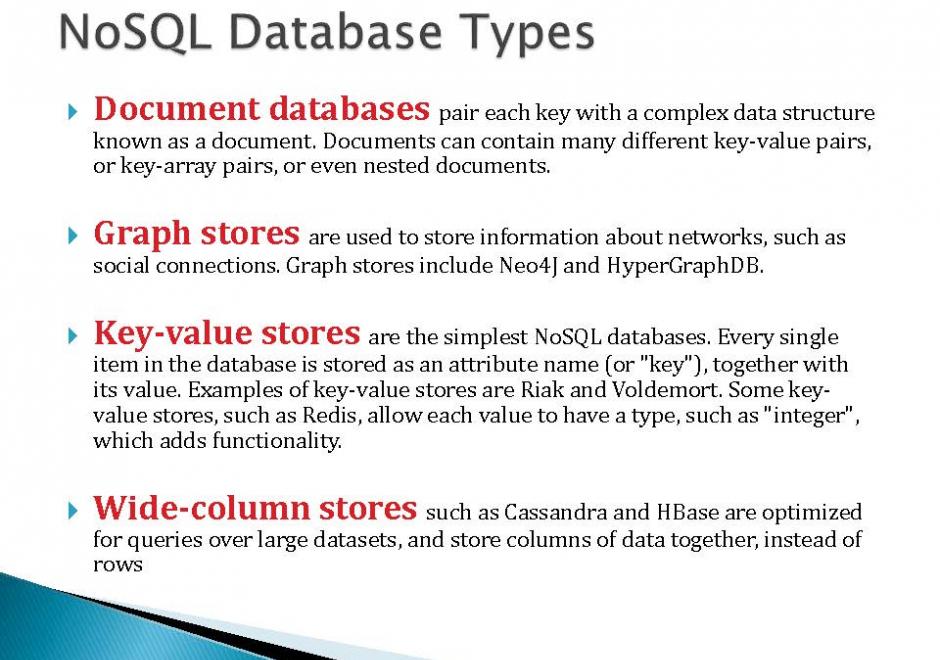
NoSQL databases are open-source, schema-less, horizontally scalable and high-performance databases. These characteristics make them very different from relational databases, the traditional choice for spatial data. The four types of data stores in NoSQL databases (key-value store, document store, column store, and graph store) contribute to significant flexibility for a range of applications. NoSQL databases are well suited to handle typical challenges of big data, including volume, variety, and velocity. For these reasons, they are increasingly adopted by private industries and used in research. They have gained tremendous popularity in the last decade due to their ability to manage unstructured data (e.g. social media data).

DM-04 - Object-oriented DBMS
  • Describe the basic elements of the object-oriented paradigm, such as inheritance, encapsulation, methods, and composition
  • Evaluate the degree to which the object-oriented paradigm does or does not approximate cognitive structures
  • Explain how the principle of inheritance can be implemented using an object-oriented programming approach
  • Defend or refute the notion that the Extensible Markup Language (XML) is a form of object-oriented database
  • Explain how the properties of object orientation allows for combining and generalizing objects
  • Evaluate the advantages and disadvantages of object-oriented databases compared to relational databases, focusing on representational power, data entry, storage efficiency, and query performance
  • Implement a GIS database design in an off-the-shelf, object-oriented database
  • Differentiate between object-oriented programming and object-oriented databases
CP-16 - On the Origins of Computing and GIS&T: Part I, A Computer Systems Perspective

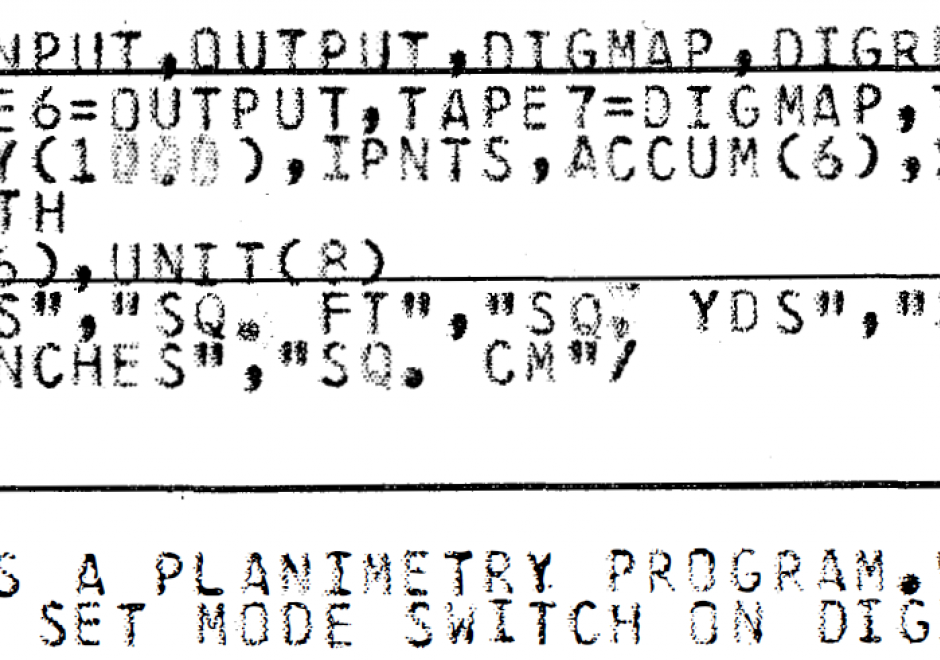
This paper describes the evolutionary path of hardware systems and the hardware-software interfaces that were used for GIS&T development during its “childhood”, the era from approximately the late 1960s to the mid-1980s.  The article is structured using a conceptualization that developments occurred during this period in three overlapping epochs that have distinctive modes of interactivity and user control: mainframes, minicomputers and workstations.  The earliest GIS&T applications were developed using expensive mainframe computer systems, usually manufactured by IBM. These mainframes typically had memory measured in kilobytes and operated in batch mode with jobs submitted using punched cards as input.  Many such systems used an obscure job control language with a rigid syntax. FORTRAN was the predominant language used for GIS&T software development. Technological developments, and associated cost reductions, led to the diffusion of minicomputers and a shift away from IBM. Further developments led to the widespread adoption of single user workstations that initially used commodity processors and later switched to reduced instruction set chips. Many minicomputers and workstations ran some variant of the UNIX operating system, which substantially improved user interactivity.

CP-32 - On the Origins of Computing and GIST: Part 2, A Perspective on the Role of Peripheral Devices

GIS implementations in the late-1960s to mid-1980s required the use of exotic peripheral devices to encode and display geospatial information. Data encoding was normally performed in one of two modes: automated raster scanning and manual (vector) coordinate recording. Raster scanning systems in this era were extremely expensive, operated in batch mode, and were located at a limited number of centralized facilities, such as federal mapping agencies. Coordinate digitizers were more widely distributed and were often configured with dedicated minicomputers to handle editing and formatting tasks. Data display devices produced hardcopy and softcopy output. Two commonly encountered hardcopy devices were line printers and pen plotters. Softcopy display consisted of cathode ray tube devices that operated using frame buffer and storage tube technologies. Each device was driven by specialized software provided by device manufacturers, leading to widespread hardware-software incompatibly. This problem led to the emergence of device independence to promote increased levels of interoperability among disparate input and output devices.

DM-80 - Ontology for Geospatial Semantic Interoperability

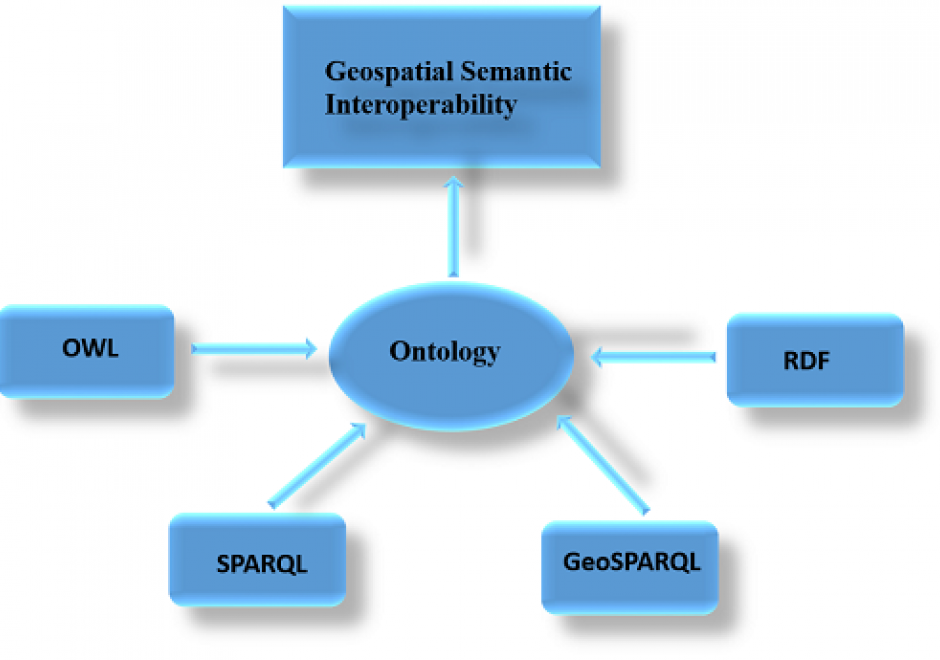
It is difficult to share and reuse geospatial data and retrieve geospatial information because of geospatial data heterogeneity problems. Lack of semantic interoperability is one of the major problems facing GIS (Geographic Information Science/System) systems and applications today. To solve geospatial data heterogeneity problems and support geospatial information retrieval and semantic interoperability over the Web, the use of an ontology is proposed because it is a formal explicit description of concepts or meanings of words in a well-defined and unambiguous manner. Geospatial ontologies represent geospatial concepts and properties for use over the Web. OWL (Ontology Web Language) is an emerging language for defining and instantiating ontologies. OWL builds on RDF (Resource Description Framework) but adds more vocabulary for describing properties and classes. The downside of representing structured geospatial data in OWL and RDF languages is that it can result in inefficient data access. SPARQL (Simple Protocol and RDF Query Language) is recommended for general RDF query while the GeoSPARQL (Geographic Simple Protocol and RDF Query Language) protocol is proposed as an extension of SPARQL for querying geospatial data. However, the runtime cost of GeoSPARQL queries can be high due to the fine-grained nature of RDF data models. There are several challenges to using ontologies for geospatial semantic interoperability but these can be overcome through collaboration.

Pages