2021 QUARTER 02

A B C D E F G H I J K L M N O P R S T U V W
CV-05 - Statistical Mapping (Enumeration, Normalization, Classification)

Proper communication of spatial distributions, trends, and patterns in data is an important component of a cartographers work. Geospatial data is often large and complex, and due to inherent limitations of size, scalability, and sensitivity, cartographers are often required to work with data that is abstracted, aggregated, or simplified from its original form. Working with data in this manner serves to clarify cartographic messages, expedite design decisions, and assist in developing narratives, but it also introduces a degree of abstraction and subjectivity in the map that can make it easy to infer false messages from the data and ultimately can mislead map readers. This entry introduces the core topics of statistical mapping around cartography. First, we define enumeration and the aggregation of data to units of enumeration. Next, we introduce the importance of data normalization (or standardization) to more truthfully communicate cartographically and, lastly, discuss common methods of data classification and how cartographers bin data into groups that simplify communication.

DC-13 - Stereoscopy and orthoimagery
  • Explain the relevance of the concept “parallax” in stereoscopic aerial imagery
  • Evaluate the advantages and disadvantages of photogrammetric methods and LiDAR for production of terrain elevation data
  • Specify the technical components of an aerotriangulation system
  • Outline the sequence of tasks involved in generating an orthoimage from a vertical aerial photograph
KE-03 - Strategic Planning for GIS Design

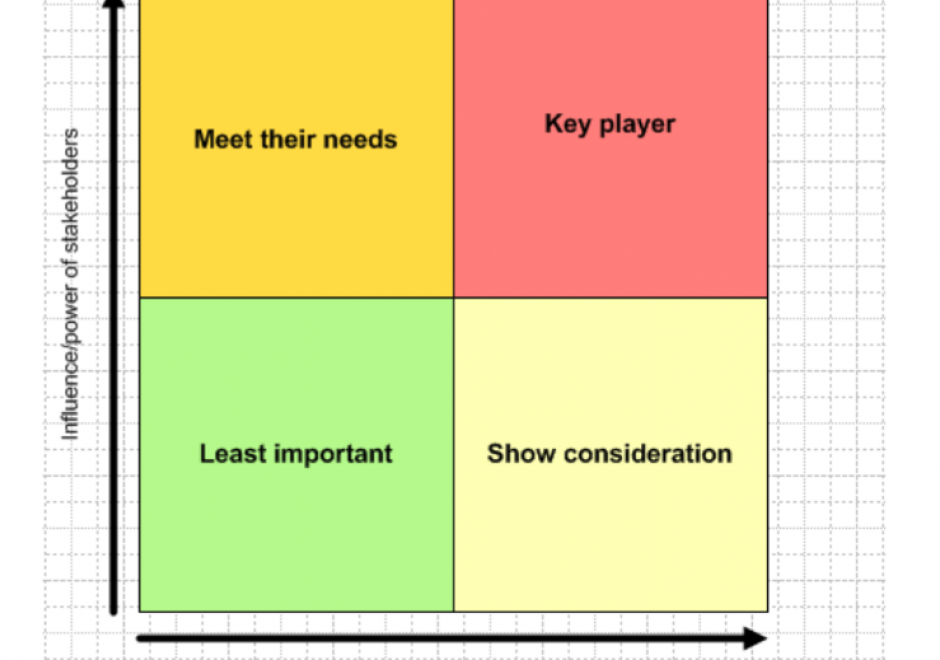
Geographic Information Systems (GIS) are pervasive and have become an essential feature in many professional disciplines. Prior to adoption, implementation or use of any GIS, a system must be properly designed to meet its organizational goals, and this requires comprehensive strategic planning to take place ahead of the design. In this article, we discuss methods for strategic planning in GIS design, drawing from literature in Information Systems and GIS research and practice, and business management. We present a four-step approach toward planning for GIS design that will ensure the system is well-suited to further an organization’s long-term functions, applications, and users’ needs.

DC-11 - Street-level Imagery

Street-level imagery consists of collections of photographs taken from the perspective of moving pedestrians or vehicles. These collections are often stitched together digitally and georeferenced to create interactive and immersive landscapes that are virtually navigable by users. Such landscapes, sometimes called 360-degree panoramas, or bubbles, are uploaded onto web platforms, and linked with geographical databases, which allows users to search and explore the imagery in various ways. IT companies such as Google have created street-level imagery platforms that rely primarily on paid drivers, although they have begun to rely on contributor submissions to complement and expand their coverage. Recently services such as Mapillary and OpenStreetCam have advanced a model that relies primarily on volunteer contributors, leveraging community interest from projects such as OpenStreetMap. While street-level imagery has become a widespread tool with multiple commercial and non-commercial applications, it is also entangled various legal and public opinion controversies, due to its capabilities for private data collection and surveillance. 

FC-12 - Structured Query Language (SQL) and attribute queries

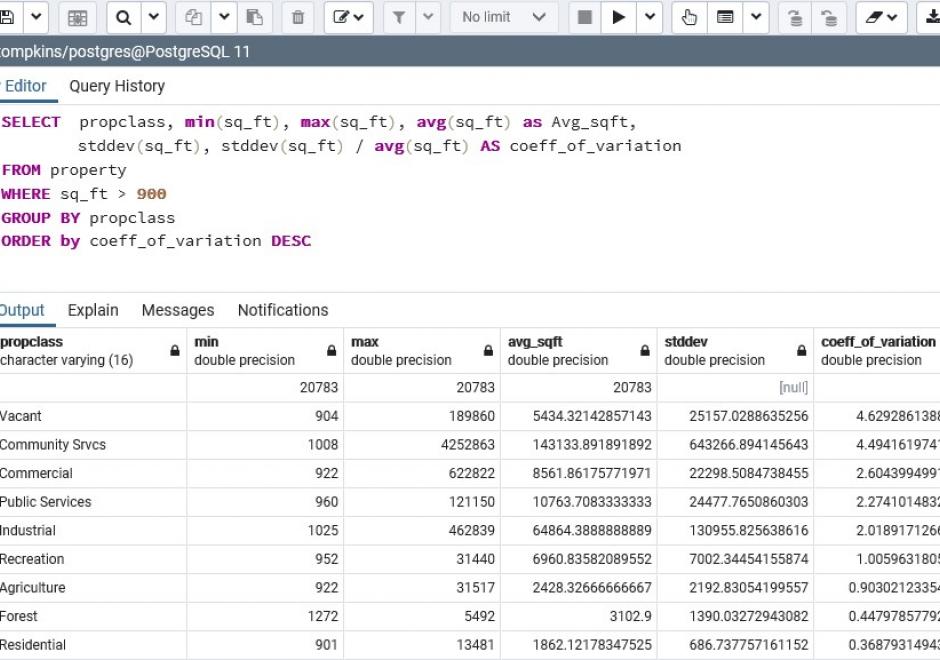
The structured query language (SQL) for database interrogation is presented and illustrated with a few examples using attribute tables one might find in a common GIS database.  A short background is presented on the history and goals that the creators of the SQL language hoped to achieve, followed by a review of SQL utility for data query, editing, and definition.  While the SQL language is rich in content and breadth, this article attempts to build on a simple SQL and then iteratively add additional complexity to highlight the power that SQL affords to the GIS professional who has limited programming capabilities.  The reader is asked to consider how minor modifications to SQL syntax can add complexity and even create more dynamic mathematical models with simple English-like command statements.  Finally, the reader is challenged to consider how terse SQL statements may be used to replace relatively long and laborious command sequences required by a GIS GUI approach.

CV-08 - Symbolization and the Visual Variables

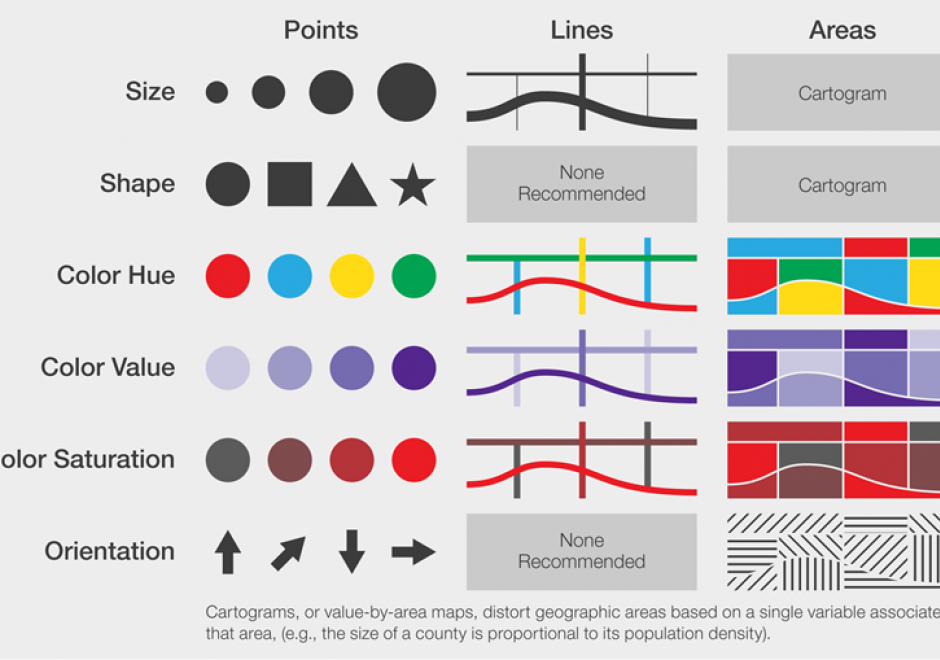
Maps communicate information about the world by using symbols to represent specific ideas or concepts. The relationship between a map symbol and the information that symbol represents must be clear and easily interpreted. The symbol design process requires first an understanding of the underlying nature of the data to be mapped (e.g., its spatial dimensions and level of measurement), then the selection of symbols that suggest those data attributes. Cartographers developed the visual variable system, a graphic vocabulary, to express these relationships on maps. Map readers respond to the visual variable system in predictable ways, enabling mapmakers to design map symbols for most types of information with a high degree of reliability.

KE-21 - System Modelling for Effective GIS Management

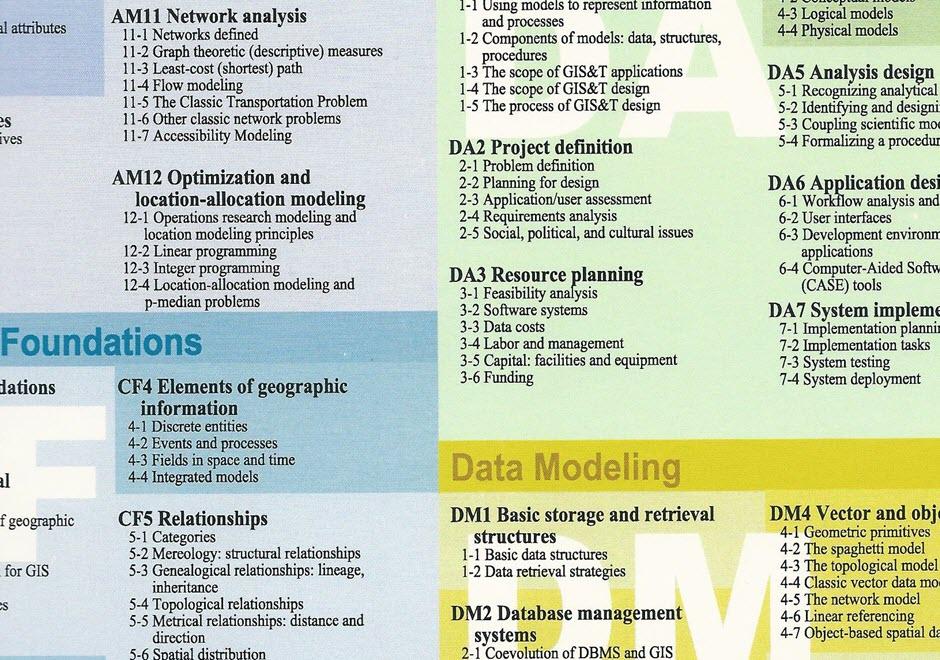
A geographic information system in operation is highly complex, as the scope of the GIS&T Body of Knowledge demonstrates. Modern society relies on many complex systems, but most are self-contained mechanisms with limited and well defined interfaces. A GIS is a complex open system that extends across the realms of hardware, software, data, science, and human processes. A conceptual model of a GIS can be an effective tool to design, implement, operate, maintain, manage, and assessment tool.

Pages