2022 QUARTER 01

A B C D E F G H I J K L M N O P R S T U V W
AM-20 - Geospatial Analysis and Model Building

Spatial modeling is an important instrument to conduct geospatial analysis to understand the world and guide decision-making. In GIS, spatial models are formal languages to express mechanisms of geographic processes and design analytical workflows to understand these processes. With the development of GIS and computer science, various types of spatial models and modeling techniques have become available, which endows the term of “spatial model” with different meanings. This entry provides an overview of common types of spatial models, modeling techniques, and related applications.

DM-71 - Geospatial Data Conflation

Spatial data conflation is the process of combining overlapping spatial datasets to produce a better dataset with higher accuracy or more information. Conflation is needed in many fields, ranging from transportation planning to the analysis of historical datasets, which require the use of multiple data sources. Geospatial data conflation becomes increasingly important with the advancement of GIS and the emergence of new sources of spatial data such as Volunteered Geographic Information.

Conceptually, conflation is a two-step process involving identifying counterpart features that correspond to the same object in reality, and merging the geometry and attributes of counterpart features. In practice, conflation can be performed either manually or with the aid of GIS with varying degrees of automation. Manual conflation is labor-intensive, time consuming and expensive. It is often adopted in practice, nonetheless, due to the lack of reliable automatic conflation methods.

A main challenge of automatic conflation lies in the automatic matching of corresponding features, due to the varying quality and different representations of map data. Many (semi-)automatic feature methods exist. They typically involve measuring the distance between each feature pair and trying to match feature pairs with smaller dissimilarity using a specially designed algorithm or model. Fully automated conflation is still an active research field.

DA-25 - Geospatial Intelligence and National Security

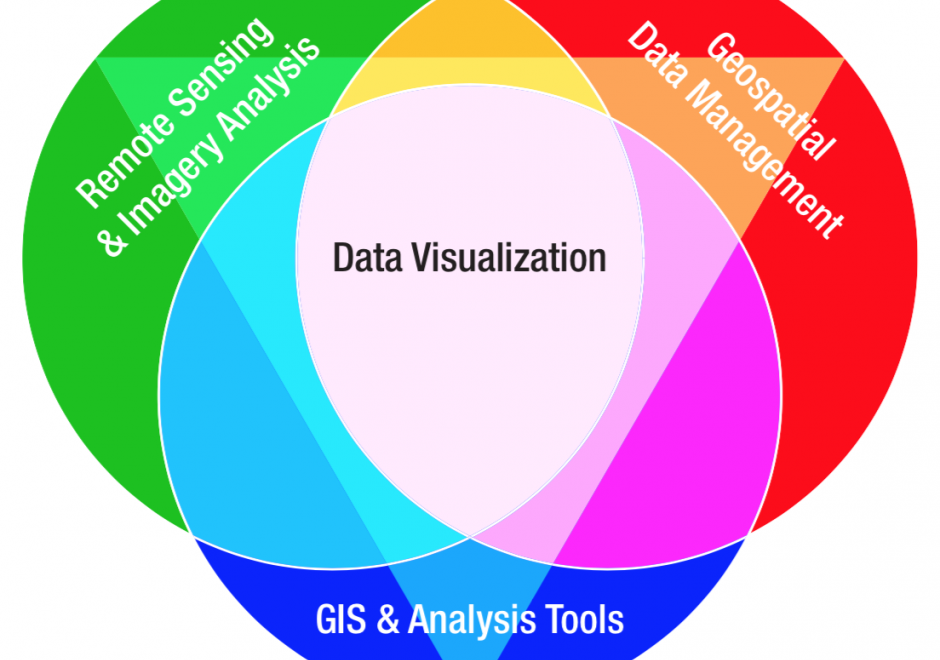
GIS&T exists within the national security enterprise as a multidisciplinary field that is now commonly referred to as Geospatial Intelligence (GEOINT).  U.S. GEOINT operations are principally managed by the National Geospatial-Intelligence Agency (NGA). GEOINT is one among several types of intelligence produced in support of national security, along with Human Intelligence (HUMINT), Signals Intelligence (SIGINT), Measurement and Signatures Intelligence (MASINT), and Open Source Intelligence (OSINT). Primary technical GEOINT skill areas include remote sensing, GIS, data management, and data visualization. The intelligence tradecraft is historically characterized as a process involving tasking, collection, processing, exploitation, and dissemination (TCPED), and supports decision-making for military, defense, and intelligence operations. The GEOINT enterprise utilizes every type of data collection platform, sensor, and imagery to develop intelligence reports. GEOINT products are used to support situational awareness, safety of navigation, arms control treaty monitoring, natural disaster response, and humanitarian relief operations. Geospatial analysts employed in government positions by NGA or serving in the U.S. armed forces are required to qualify in NGA’s GEOINT Professional Certification (GPC) program, and industry contractors have the option of qualifying under the United States Geospatial Intelligence Foundation (USGIF) Certified GEOINT Professional (CGP) program.

CP-05 - Geospatial Technology Transfer Opportunities, and a Case Study of the Taghreed System

The technology transfer process moves research ideas from preliminary stages in research labs and universities to industrial products and startup companies. Such transfers significantly contribute to producing new computing platforms, services, and geospatial data products based on state-of-the-art research. To put technology transfer in perspective, this entry highlights key lessons learned through the process of transferring the Taghreed System from a research and development (R&D) lab to an industrial product. Taghreed is a system that supports scalable geospatial data analysis on social media microblogs data. Taghreed is primarily motivated by the large percentage of mobile microblogs users, over 80%, which has led to greater availability of geospatial content in microblogs beyond anytime in the digital data history. Taghreed has been commercialized and is powering a startup company that provides social media analytics based on full Twitter data archive.

CV-36 - Geovisual Analytics

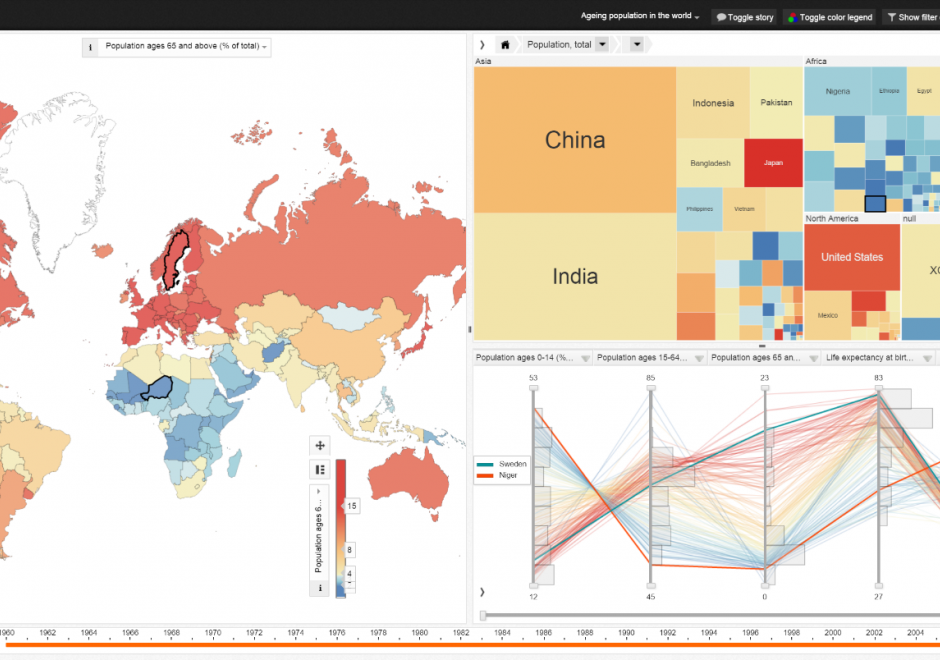
Geovisual analytics refers to the science of analytical reasoning with spatial information as facilitated by interactive visual interfaces. It is distinguished by its focus on novel approaches to analysis rather than novel approaches to visualization or computational methods alone. As a result, geovisual analytics is usually grounded in real-world problem solving contexts. Research in geovisual analytics may focus on the development of new computational approaches to identify or predict patterns, new visual interfaces to geographic data, or new insights into the cognitive and perceptual processes that users apply to solve complex analytical problems. Systems for geovisual analytics typically feature a high-degree of user-driven interactivity and multiple visual representation types for spatial data. Geovisual analytics tools have been developed for a variety of problem scenarios, such as crisis management and disease epidemiology. Looking ahead, the emergence of new spatial data sources and display formats is expected to spur an expanding set of research and application needs for the foreseeable future. 

CV-35 - Geovisualization

Geovisualization is primarily understood as the process of interactively visualizing geographic information in any of the steps in spatial analyses, even though it can also refer to the visual output (e.g., plots, maps, combinations of these), or the associated techniques. Rooted in cartography, geovisualization emerged as a research thrust with the leadership of Alan MacEachren (Pennsylvania State University) and colleagues when interactive maps and digitally-enabled exploratory data analysis led to a paradigm shift in 1980s and 1990s. A core argument for geovisualization is that visual thinking using maps is integral to the scientific process and hypothesis generation, and the role of maps grew beyond communicating the end results of an analysis or documentation process. As such, geovisualization interacts with a number of disciplines including cartography, visual analytics, information visualization, scientific visualization, statistics, computer science, art-and-design, and cognitive science; borrowing from and contributing to each. In this entry, we provide a definition and a brief history of geovisualization including its fundamental concepts, elaborate on its relationship to other disciplines, and briefly review the skills/tools that are relevant in working with geovisualization environments. We finish the entry with a list of learning objectives, instructional questions, and additional resources.

CP-27 - GIS and Computational Notebooks

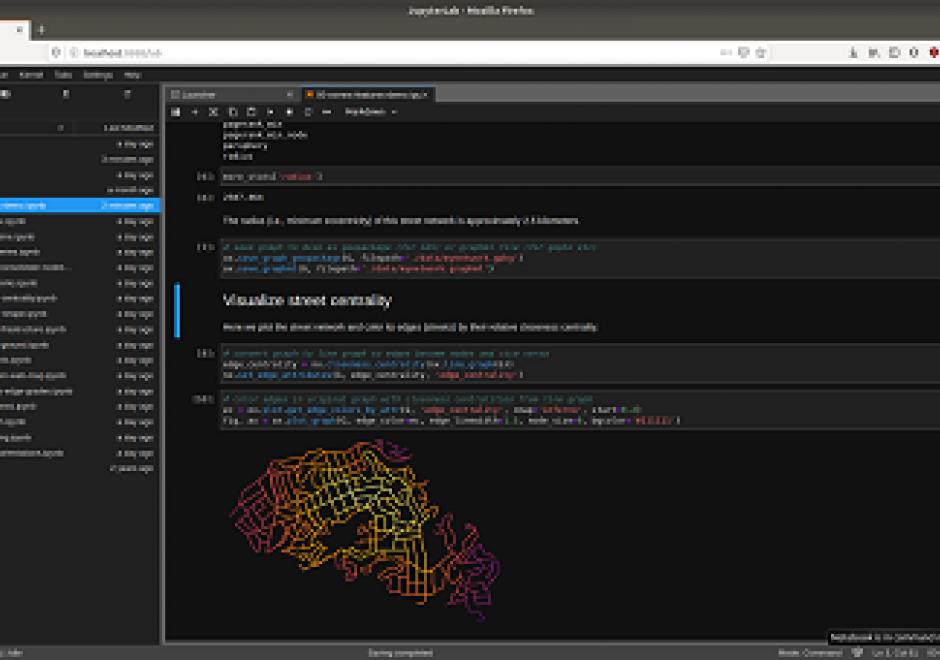
Researchers and practitioners across many disciplines have recently adopted computational notebooks to develop, document, and share their scientific workflows—and the GIS community is no exception. This chapter introduces computational notebooks in the geographical context. It begins by explaining the computational paradigm and philosophy that underlie notebooks. Next it unpacks their architecture to illustrate a notebook user’s typical workflow. Then it discusses the main benefits notebooks offer GIS researchers and practitioners, including better integration with modern software, more natural access to new forms of data, and better alignment with the principles and benefits of open science. In this context, it identifies notebooks as the “glue” that binds together a broader ecosystem of open source packages and transferable platforms for computational geography. The chapter concludes with a brief illustration of using notebooks for a set of basic GIS operations. Compared to traditional desktop GIS, notebooks can make spatial analysis more nimble, extensible, and reproducible and have thus evolved into an important component of the geospatial science toolkit.

GS-14 - GIS and Critical Ethics

This entry discusses and defines ethical critiques and GIS. It complements other GIS&T Body of Knowledge entries on Professional and Practical Ethics and Codes of Ethics for GIS Professionals. Critical ethics is presented as the attempt to provide a better understanding of data politics. Knowledge is never abstract or non-material. Spatial data, as a form of knowledge, may mask, conceal, disallow or disavow, even as it speaks, permits and claims. A critical ethics of GIS investigates this situated power-knowledge. Two concepts from educational pedagogy are suggested: threshold and troublesome knowledge. As we use and continue to learn GIS, these concepts may enrich our experience by usefully leading us astray. This points finally to how ethical critique is practical, empirical and political, rather than abstract or theoretical.

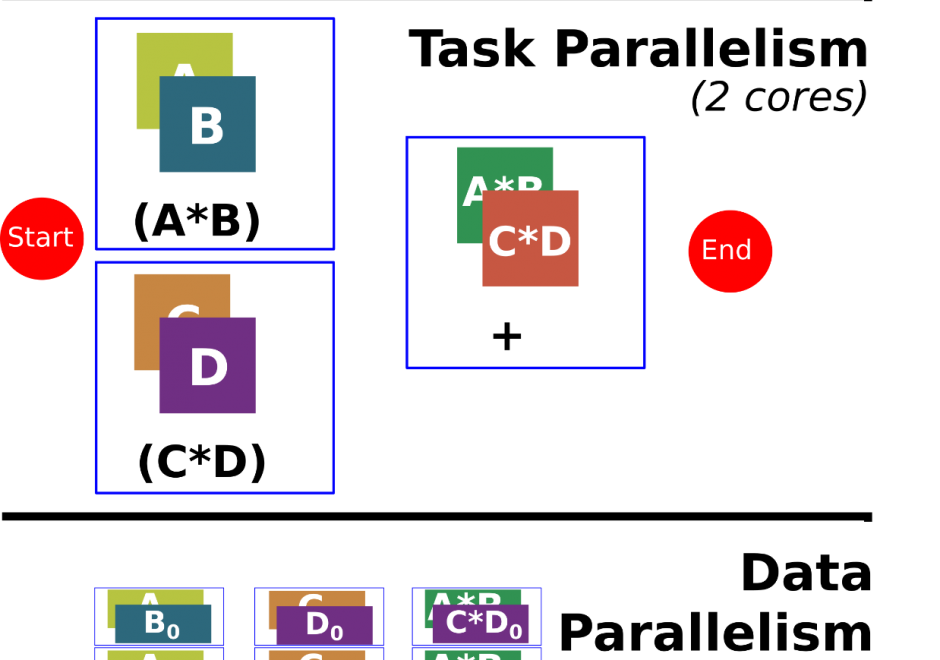
PD-14 - GIS and Parallel Programming

Programming is a sought after skill in GIS, but traditional programming (also called serial programming) only uses one processing core. Modern desktop computers, laptops, and even cellphones now have multiple processing cores, which can be used simultaneously to increase processing capabilities for a range of GIS applications. Parallel programming is a type of programming that involves using multiple processing cores simultaneously to solve a problem, which enables GIS applications to leverage more of the processing power on modern computing architectures ranging from desktop computers to supercomputers. Advanced parallel programming can leverage hundreds and thousands of cores on high-performance computing resources to process big spatial datasets or run complex spatial models.

Parallel programming is both a science and an art. While there are methods and principles that apply to parallel programming--when, how, and why certain methods are applied over others in a specific GIS application remains more of an art than a science. The following sections introduce the concept of parallel programming and discuss how to parallelize a spatial problem and measure parallel performance.

PD-19 - GIS APIs

GIS APIs are collections of library modules that resemble various functionalities of GIS software through programming. GIS APIs evolved from desktop GIS. GIS APIs, as a distributed solution, are interoperable, scalable, light-weight, user-friendly, and versatile to a wide range of GIS users. This entry provides an overview of common GIS APIs, their functionalities as well as other related APIs. The general procedure to develop customized GIS applications is briefly discussed and demonstrated in a case study.

Pages