Data Management

Data management involves the theories and techniques for managing the entire data lifecycle, from data collection to data format conversion, from data storage to data sharing and retrieval, to data provenance, data quality control and data curation for long-term data archival and preservation.

Topics in this Knowledge Area are listed thematically below. Existing topics are in regular font and linked directly to their original entries (published in 2006; these contain only Learning Objectives). Entries that have been updated and expanded are in bold. Forthcoming, future topics are italicized


Spatial Databases Spatial Access Methods Georeferencing Systems
Spatial Database Management Systems Data Retrieval Strategies Earth's Shape, Sea Level, and the Geoid
Use of Relational DBMSs Spatial Indexing Geographic Coordinate Systems
Object-Oriented DBMSs Space-driven Structures: Grid, linear quadtree, and z-ordering tree files Planar Coordinate Systems
Relational DBMS and their Spatial Extensions Data-driven structures: R-trees and cost models Tesselated Referencing Systems
Topological Relationships Modeling Unstructured Spatial Data Linear Referencing
Database Administration Modeling Semi-Structured Spatial Data Vertical (Geopotential) Datums
Conceptual Data Models   Horizontal (Geometric) Datums
Logical Data Models Query Processing Georegistration
Physical Data Models Optimal I/O Algorithms Map Projections
NoSQL Databases Spatial Joins  
Problems with Large Spatial Databases Complex Queries Data Manipulation
Array Databases Spatial Data Infrastructures Point, Line, and Area Generalization
Representations of Spatial Objects Metadata Vector-to-Raster and Raster-to-Vector Conversions
Events and Processes Content Standards Raster Resampling
Raster Data Models Data Warehouses Coordinate Transformations
Vector Data Models Spatial Data Infrastructures Transaction Management
Topological Models U.S. National Spatial Data Infrastructure  
Network Models Ontology for Geospatial Semantic Interoperability  
Entity-based Models Marine Spatial Data Infrastructure  
Modeling 3D Entities Hydrographic Geospatial Data Standards  
Fields in Space and Time    
Fuzzy Models    
Triangular Irregular Network (TIN) Models    
Genealogical Relationships, Linkage, and Inheritance    
Geospatial Data Conflation    


DM-23 - Fields in space and time
  • Define a field in terms of properties, space, and time
  • Formalize the notion of field using mathematical functions and calculus
  • Recognize the influences of scale on the perception and meaning of fields
  • Evaluate the field view’s description of “objects” as conceptual discretizations of continuous patterns
  • Identify applications and phenomena that are not adequately modeled by the field view
  • Identify examples of discrete and continuous change found in spatial, temporal, and spatio-temporal fields
  • Relate the notion of field in GIS to the mathematical notions of scalar and vector fields
  • Differentiate various sources of fields, such as substance properties (e.g., temperature), artificial constructs (e.g., population density), and fields of potential or influence (e.g., gravity)
DM-41 - Fuzzy logic
  • Describe how linear functions are used to fuzzify input data (i.e., mapping domain values to linguistic variables)
  • Support or refute the statement by Lotfi Zadeh, that “As complexity rises, precise statements lose meaning and meaningful statements lose precision,” as it relates to GIS&T
  • Explain why fuzzy logic, rather then Boolean algebra models, can be useful for representing real world boundaries between different tree species
DM-27 - Genealogical relationships: lineage, inheritance
  • Describe ways in which a geographic entity can be created from one or more others
  • Discuss the effects of temporal scale on the modeling of genealogical structures
  • Describe the genealogy (as identity-based change or temporal relationships) of particular geographic phenomena
  • Determine whether it is important to represent the genealogy of entities for a particular application
DM-56 - Georegistration
  • Differentiate rectification and orthorectification
  • Identify and explain an equation used to perform image-to-map registration
  • Identify and explain an equation used to perform image-to-image registration
  • Use GIS software to transform a given dataset to a specified coordinate system, projection, and datum
  • Explain the role and selection criteria for “ground control points” (GCPs) in the georegistration of aerial imagery
DM-71 - Geospatial Data Conflation

Spatial data conflation is the process of combining overlapping spatial datasets to produce a better dataset with higher accuracy or more information. Conflation is needed in many fields, ranging from transportation planning to the analysis of historical datasets, which require the use of multiple data sources. Geospatial data conflation becomes increasingly important with the advancement of GIS and the emergence of new sources of spatial data such as Volunteered Geographic Information.

Conceptually, conflation is a two-step process involving identifying counterpart features that correspond to the same object in reality, and merging the geometry and attributes of counterpart features. In practice, conflation can be performed either manually or with the aid of GIS with varying degrees of automation. Manual conflation is labor-intensive, time consuming and expensive. It is often adopted in practice, nonetheless, due to the lack of reliable automatic conflation methods.

A main challenge of automatic conflation lies in the automatic matching of corresponding features, due to the varying quality and different representations of map data. Many (semi-)automatic feature methods exist. They typically involve measuring the distance between each feature pair and trying to match feature pairs with smaller dissimilarity using a specially designed algorithm or model. Fully automated conflation is still an active research field.

DM-11 - Hierarchical data models
  • Illustrate the quadtree model
  • Describe the advantages and disadvantages of the quadtree model for geographic database representation and modeling
  • Describe alternatives to quadtrees for representing hierarchical tessellations (e.g., hextrees, rtrees, pyramids)
  • Explain how quadtrees and other hierarchical tessellations can be used to index large volumes of raster or vector data
  • Implement a format for encoding quadtrees in a data file
DM-52 - Horizontal (Geometric) Datums

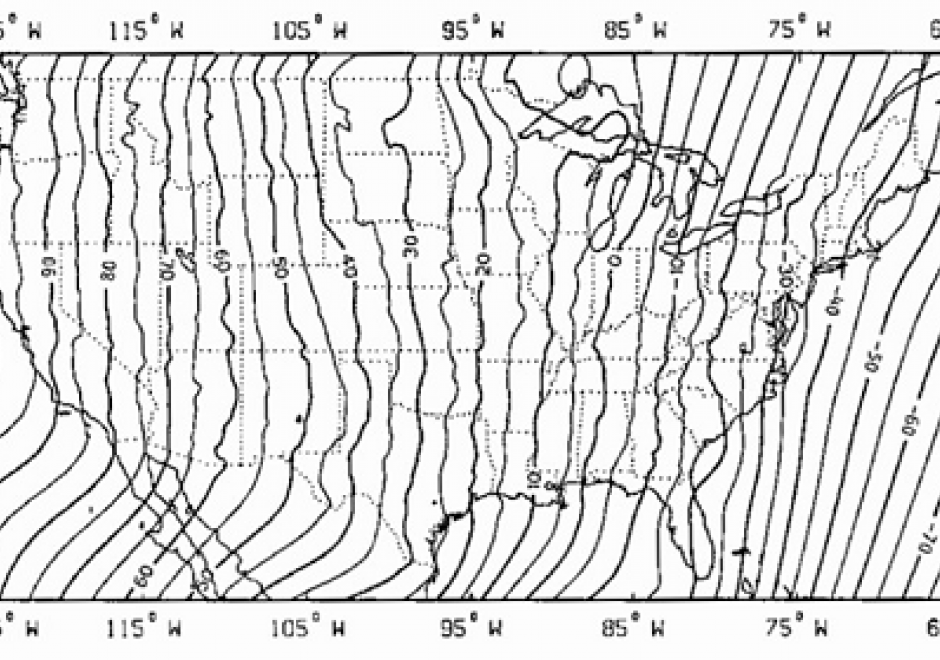
A horizontal (geometric) datum provides accurate coordinates (e.g., latitude and longitude) for points on Earth’s surface. Historically, surveyors developed a datum using optically sighted instruments to manually place intervisible survey marks in the ground. This survey work incorporated geometric principles of baselines, distances, and azimuths through the process of triangulation to attach a coordinate value to each survey mark. Triangulation produced a geodetic network of interconnected survey marks that realized the datum (i.e., connecting the geometry of the network to Earth’s physical surface). For local surveys, these datums provided reasonable positional accuracies on the order of meters. Importantly, once placed in the ground, these survey marks were passive; a new survey was needed to determine any positional changes (e.g., due to plate motion) and to update the attached coordinate values. Starting in the 1950s, due to the implementation of active control, space-based satellite geodesy changed how geodetic networks were realized. Here, "active" implies that a survey mark’s coordinates are updated in near real-time through, for example, artificial satellites such as GNSS. Increasingly, GNSS and satellite geodesy is paving the way for a modernized geometric datum that is global in scope and capable of providing positional accuracies at the millimeter level.

DM-90 - Hydrographic Geospatial Data Standards

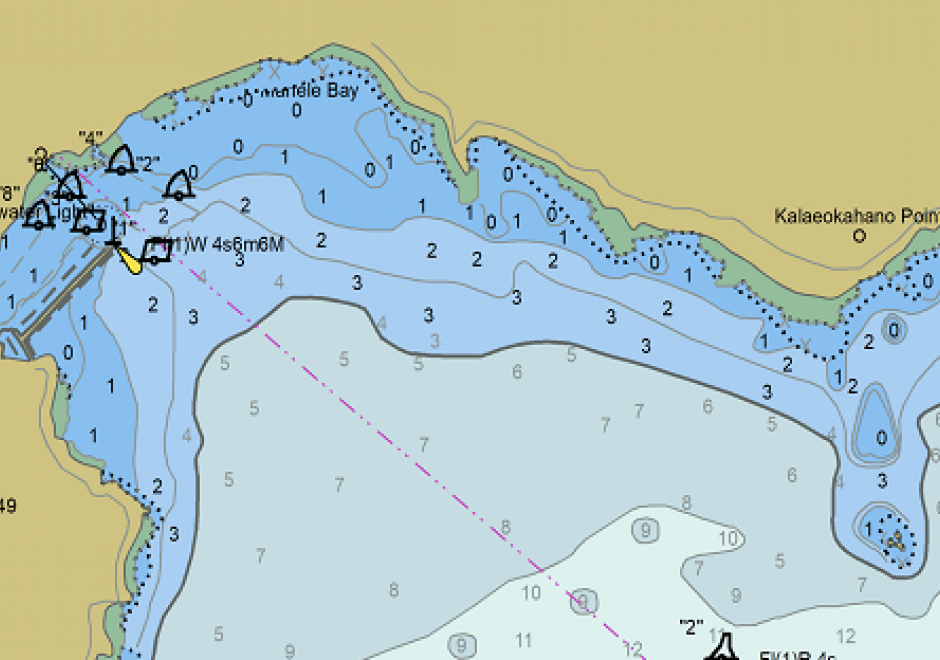
Coastal nations, through their dedicated Hydrographic Offices (HOs), have the obligation to provide nautical charts for the waters of national jurisdiction in support of safe maritime navigation. Accurate and reliable charts are essential to seafarers whether for commerce, defense, fishing, or recreation. Since navigation can be an international activity, mariners often use charts published from different national HOs. Standardization of data collection and processing, chart feature generalization methods, text, symbology, and output validation becomes essential in providing mariners with consistent and uniform products regardless of the region or the producing nation. Besides navigation, nautical charts contain information about the seabed and the coastal environment useful in other domains such as dredging, oceanography, geology, coastal modelling, defense, and coastal zone management. The standardization of hydrographic and nautical charting activities is achieved through various publications issued by the International Hydrographic Organization (IHO). This chapter discusses the purpose and importance of nautical charts, the establishment and role of the IHO in coordinating HOs globally, the existing hydrographic geospatial data standards, as well as those under development based on the new S-100 Universal Hydrographic Data Model.

DM-16 - Linear Referencing

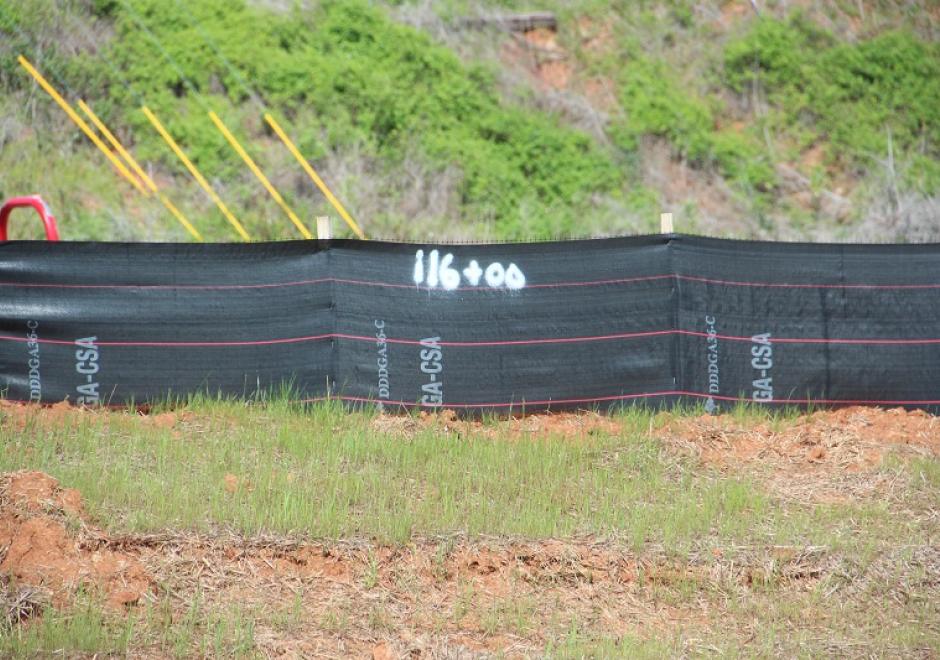
Linear referencing is a term that encompasses a family of concepts and techniques for associating features with a spatial location along a network, rather than referencing those locations to a traditional spherical or planar coordinate system. Linear referencing is used when the location on the network, and the relationships to other locations on the network, are more significant than the location in 2D or 3D space. Linear referencing is commonly used in transportation applications, including roads, railways, and pipelines, although any network structure can be used as the basis for linearly referenced features. Several data models for storing linearly referenced data are available, and well-defined sets of procedures can be used to implement linear referencing for a particular application. As network analysis and network based statistical analysis become more prevalent across disciplines, linear referencing is likely to remain an important component of the data used for such analyses.

DM-35 - Logical Data Models

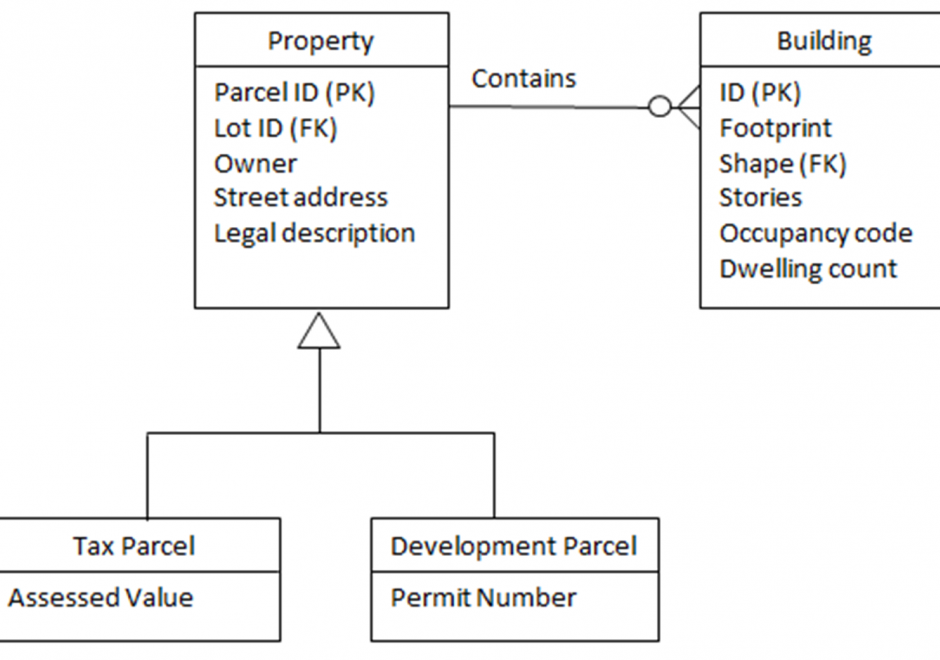
A logical data model is created for the second of three levels of abstraction, conceptual, logical, and physical. A logical data model expresses the meaning context of a conceptual data model, and adds to that detail about data (base) structures, e.g. using topologically-organized records, relational tables, object-oriented classes, or extensible markup language (XML) construct  tags. However, the logical data model formed is independent of a particular database management software product. Nonetheless such a model is often constrained by a class of software language techniques for representation, making implementation with a physical data model easier. Complex entity types of the conceptual data model must be translated into sub-type/super-type hierarchies to clarify data contexts for the entity type, while avoiding duplication of concepts and data. Entities and records should have internal identifiers. Relationships can be used to express the involvement of entity types with activities or associations. A logical schema is formed from the above data organization. A schema diagram depicts the entity, attribute and relationship detail for each application. The resulting logical data models can be synthesized using schema integration to support multi-user database environments, e.g., data warehouses for strategic applications and/or federated databases for tactical/operational business applications.

Pages