Search Page

Showing 1 - 10 of 17
CV-04 - Scale and Generalization

Scale and generalization are two fundamental, related concepts in geospatial data. Scale has multiple meanings depending on context, both within geographic information science and in other disciplines. Typically it refers to relative proportions between objects in the real world and their representations. Generalization is the act of modifying detail, usually reducing it, in geospatial data. It is often driven by a need to represent data at coarsened resolution, being typically a consequence of reducing representation scale. Multiple computations and graphical modication processes can be used to achieve generalization, each introducing increased abstraction to the data, its symbolization, or both.

CV-21 - Map Reading

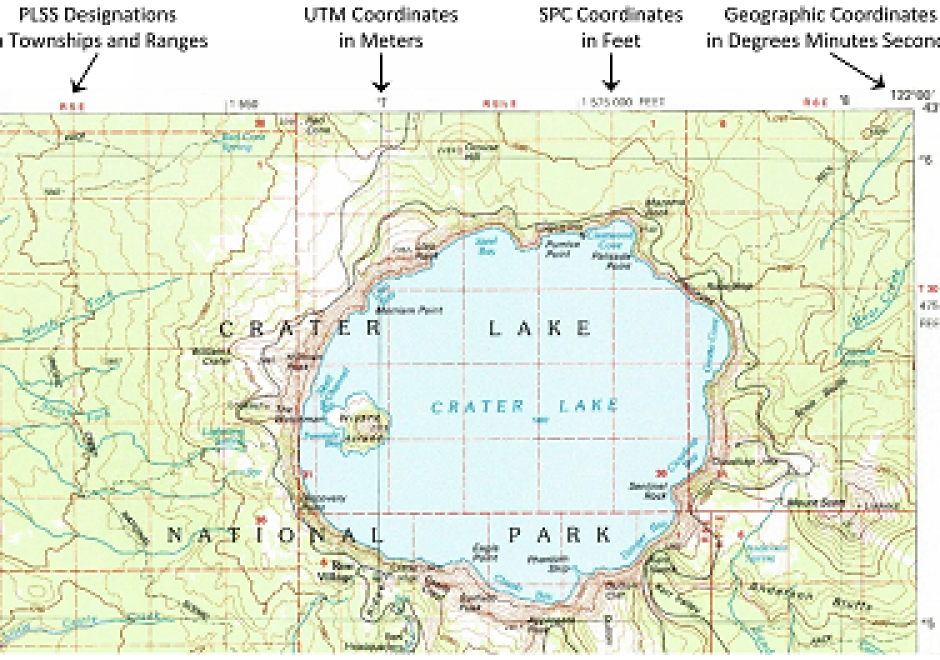
Map reading is the process of looking at the map to determine what is depicted and how the cartographer depicted it. This involves identifying the features or phenomena portrayed, the symbols and labels used, and information about the map that may not be displayed on the map. Reading maps accurately and effectively requires at least a basic understanding of how the mapmaker has made important cartographic decisions relating to map scale, map projections, coordinate systems, and cartographic compilation (selection, classification, generalization, and symbolization). Proficient map readers also appreciate artifacts of the cartographic compilation process that improve readability but may also affect map accuracy and uncertainty. Masters of map reading use maps to gain better understanding of their environment, develop better mental maps, and ultimately make better decisions. Through successful map reading, a person’s cartographic and mental maps will merge to tune the reader’s spatial thinking to the reality of the environment.

CV-29 - Design and Aesthetics

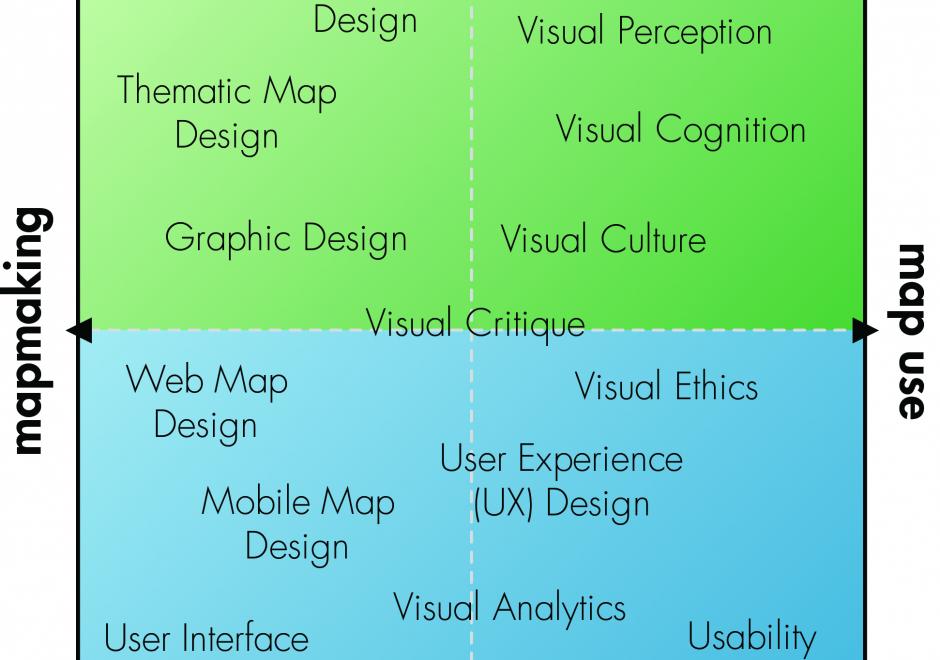
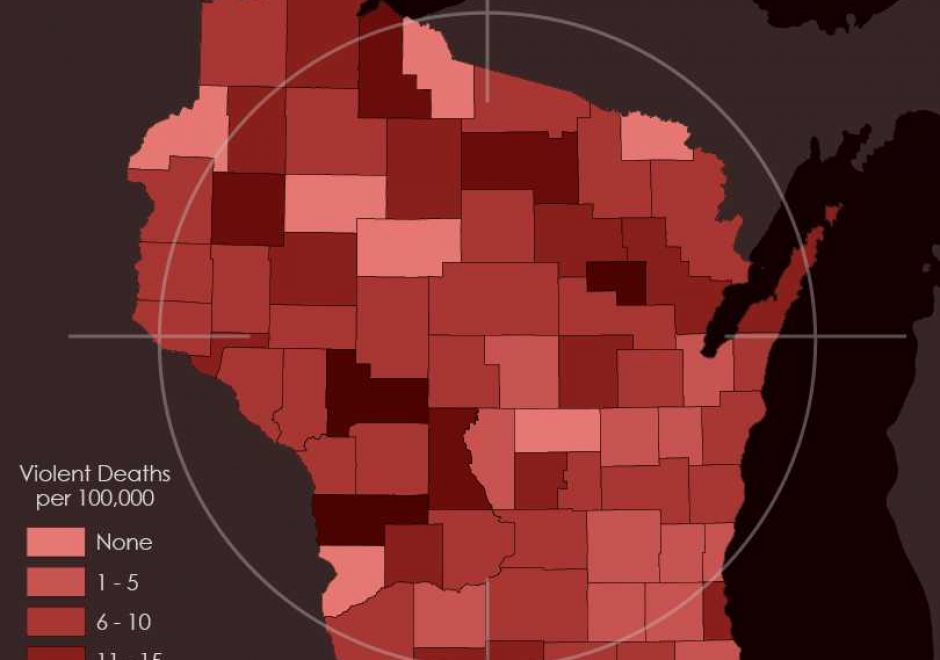
Design and aesthetics are fundamental to cartographic practice. Developing students’ skills in design and aesthetics is a critical part of cartography education, yet design is also one of the most difficult part of the cartographic process. The cartographic design process of planning, creating, critiquing, and revising maps provides a method for making maps with intentional design decisions, utilizing an understanding of aesthetics to promote clarity and cohesion to attract the user and facilitate an emotional response. In this entry, cartographic design and the cartographic design process are reviewed, and the concepts of aesthetics, style, and taste are explained in the context of cartographic design.

CV-40 - Mobile Maps and Responsive Design

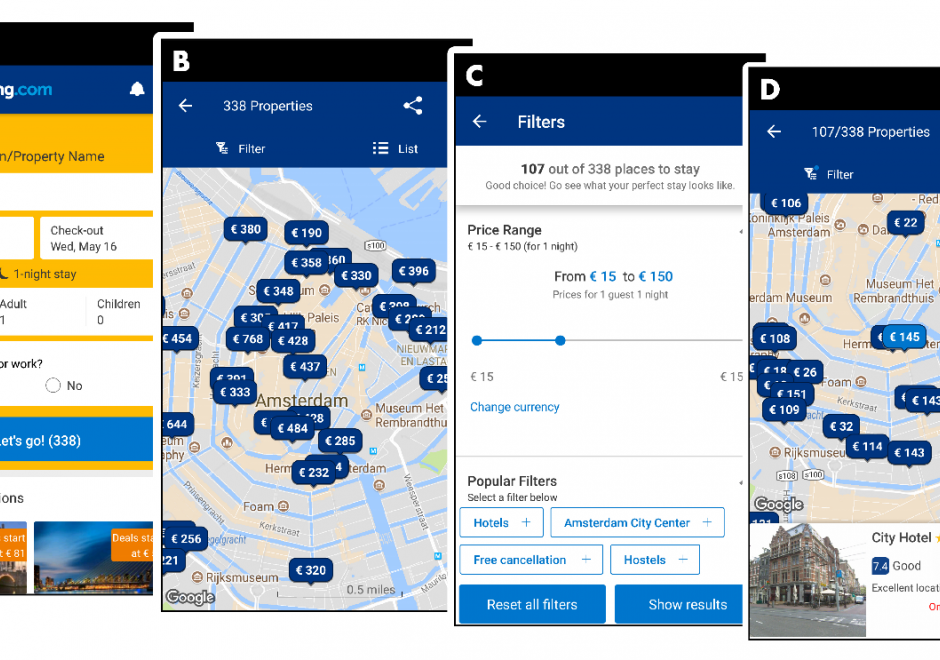
Geographic information increasingly is produced and consumed on mobile devices. The rise of mobile mapping is challenging traditional design conventions in research, industry, and education, and cartographers and GIScientists now need to accommodate this mobile context. This entry introduces emerging design considerations for mobile maps. First, the technical enablements and constraints that make mobile devices unique are described, including Global Positioning System (GPS) receivers and other sensors, reduced screensize and resolution, reduced processing power and memory capacity, less reliable data connectivity, reduced bandwidth, and physical mobility through variable environmental conditions. Scholarly influences on mobile mapping also are reviewed, including location-based services, adaptive cartography, volunteered geographic information, and locational privacy. Next, two strategies for creating mobile maps are introduced—mobile apps installed onto mobile operating systems versus responsive web maps that work on mobile and nonmobile devices—and core concepts of responsive web design are reviewed, including fluid grids, media queries, breakpoints, and frameworks. Finally, emerging design recommendations for mobile maps are summarized, with representation design adaptations needed to account for reduced screensizes and bandwidth and interaction design adaptations needed to account for multi-touch interaction and post-WIMP interfaces.

CV-05 - Statistical Mapping (Enumeration, Normalization, Classification)

Proper communication of spatial distributions, trends, and patterns in data is an important component of a cartographers work. Geospatial data is often large and complex, and due to inherent limitations of size, scalability, and sensitivity, cartographers are often required to work with data that is abstracted, aggregated, or simplified from its original form. Working with data in this manner serves to clarify cartographic messages, expedite design decisions, and assist in developing narratives, but it also introduces a degree of abstraction and subjectivity in the map that can make it easy to infer false messages from the data and ultimately can mislead map readers. This entry introduces the core topics of statistical mapping around cartography. First, we define enumeration and the aggregation of data to units of enumeration. Next, we introduce the importance of data normalization (or standardization) to more truthfully communicate cartographically and, lastly, discuss common methods of data classification and how cartographers bin data into groups that simplify communication.

CV-08 - Symbolization and the Visual Variables

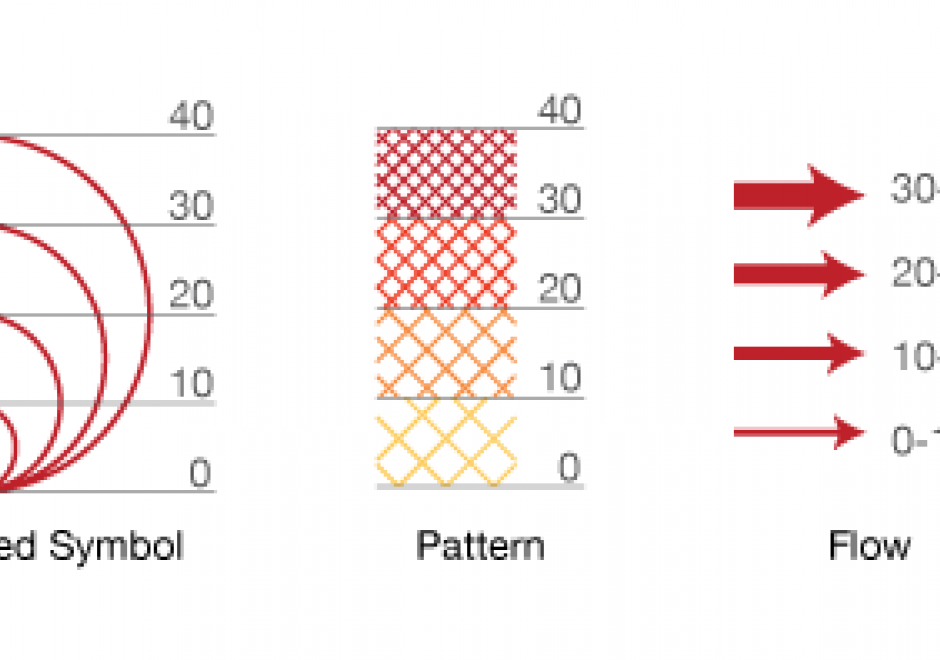
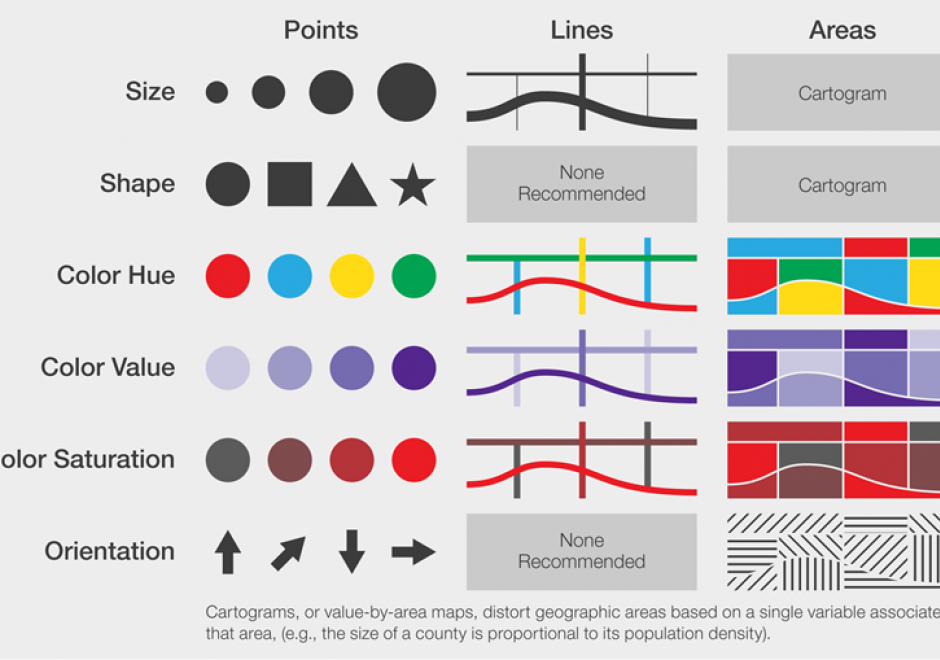
Maps communicate information about the world by using symbols to represent specific ideas or concepts. The relationship between a map symbol and the information that symbol represents must be clear and easily interpreted. The symbol design process requires first an understanding of the underlying nature of the data to be mapped (e.g., its spatial dimensions and level of measurement), then the selection of symbols that suggest those data attributes. Cartographers developed the visual variable system, a graphic vocabulary, to express these relationships on maps. Map readers respond to the visual variable system in predictable ways, enabling mapmakers to design map symbols for most types of information with a high degree of reliability.

CV-03 - Vector Formats and Sources

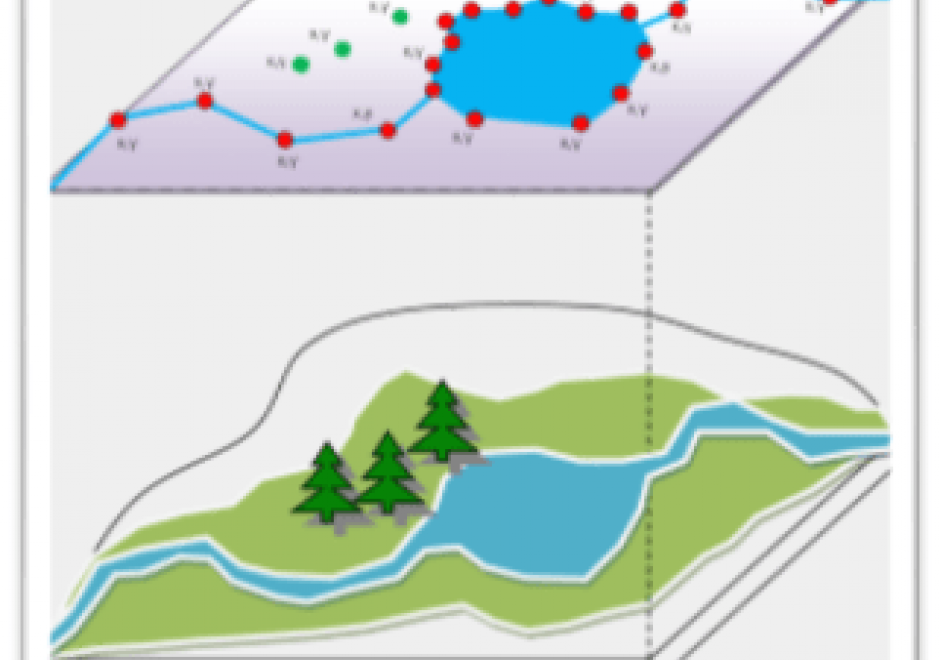
In the last ten years, the rise of efficient computing devices with significant processing power and storage has caused a surge in digital data collection and publication. As more software programs and hardware devices are released, we are not only seeing an increase in available data, but also an increase in available data formats. Cartographers today have access to a wide range of interesting datasets, and online portals for downloading geospatial data now frequently offer that data in several different formats. This chapter provides information useful to modern cartographers working with vector data, including an overview of common vector data formats (e.g. shapefile, GeoJSON, file geodatabase); their relative benefits, idiosyncrasies, and limitations; and a list of popular sources for geospatial vector data (e.g. United States Census Bureau, university data warehouses).

CV-30 - Map Production and Management

Map production describes the experience of managing the many aspects and details of map creation. Often the map product is created for someone else—a client, supervisor, or instructor. Describing the intention of the map and evaluating available resources ahead of the project can help the cartographer define content requirements, stay on task, and ultimately meet deadlines. The project management life cycle involves clear communication between the cartographer and client, with resolutions to common questions best addressed at the beginning of the project. The process then iteratively cycles through phases that include research and production, followed by quality control, and concludes with file preparation and delivery.

CV-34 - Map Icon Design

The use of map icons is an efficient way to condense a map object into a concise expression of geospatial data. Like all cartographic design, map icon design merges artistic and scientific elements into symbolic representations intended to be readily legible to map readers. This entry reviews the types of map icons and elements of icon design, including the ways in which the visual variables are used in map icon communication. As communicative devices, icons are imbued with cultural meanings and can oftentimes lead to the preservation of stereotypes. This review concludes with an examination of icons’ perpetuation of – and challenge to – cultural stereotypes.

CV-13 - User Interface and User Experience (UI/UX) Design

Advances in personal computing and information technologies have fundamentally transformed how maps are produced and consumed, as many maps today are highly interactive and delivered online or through mobile devices. Accordingly, we need to consider interaction as a fundamental complement to representation in cartography and visualization. UI (user interface) / UX (user experience) describes a set of concepts, guidelines, and workflows for critically thinking about the design and use of an interactive product, map or otherwise. This entry introduces core concepts from UI/UX design important to cartography and visualization, focusing on issues related to visual design. First, a fundamental distinction is made between the use of an interface as a tool and the broader experience of an interaction, a distinction that separates UI design and UX design. Norman’s stages of interaction framework then is summarized as a guiding model for understanding the user experience with interactive maps, noting how different UX design solutions can be applied to breakdowns at different stages of the interaction. Finally, three dimensions of UI design are described: the fundamental interaction operators that form the basic building blocks of an interface, interface styles that implement these operator primitives, and recommendations for visual design of an interface.

Pages