basic analytical methods

AM-10 - Spatial Interaction

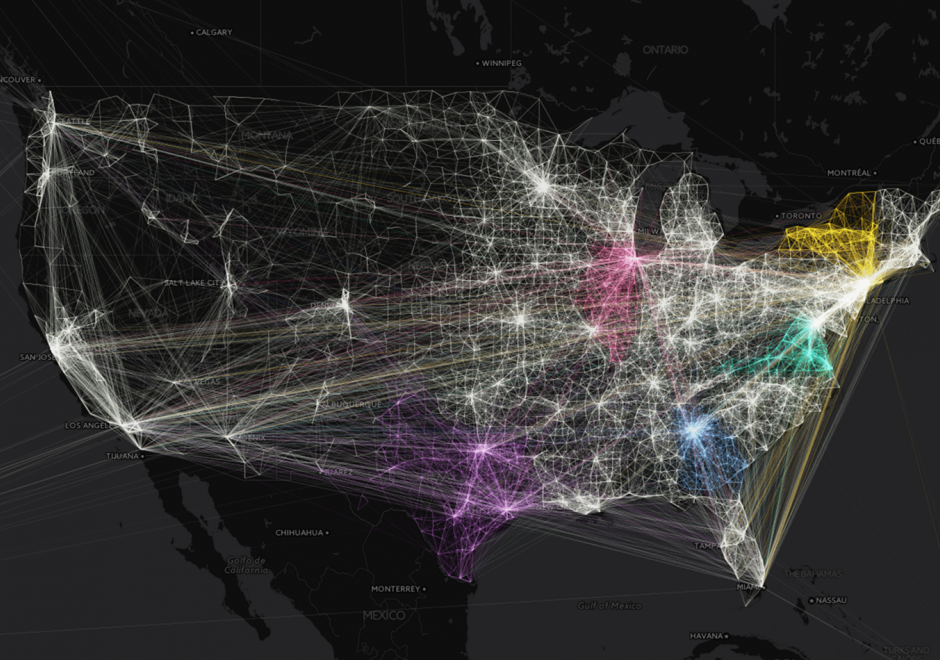
Spatial interaction (SI) is a fundamental concept in the GIScience literature, and may be defined in numerous ways. SI often describes the "flow" of individuals, commodities, capital, and information over (geographic) space resulting from a decision process. Alternatively, SI is sometimes used to refer to the influence of spatial proximity of places on the intensity of relations between those places. SI modeling as a separate research endeavor developed out of a need to mathematically model and understand the underlying determinants of these flows/influences. Proponents of SI modeling include economic geographers, regional scientists, and regional planners, as well as climate scientists, physicists, animal ecologists, and even some biophysical/environmental researchers. Originally developed from theories of interacting particles and gravitational forces in physics, SI modeling has developed through a series of refinements in terms of functional form, conceptual representations of distances, as well as a range of analytically rigorous technical improvements.
 

AM-09 - Cluster analysis
  • Identify several cluster detection techniques and discuss their limitations
  • Demonstrate the extension of spatial clustering to deal with clustering in space-time using the Know and Mantel tests
  • Perform a cluster detection analysis to detect “hot spots” in a point pattern
  • Discuss the characteristics of the various cluster detection techniques
AM-08 - Kernels and density estimation
  • Describe the relationships between kernels and classical spatial interaction approaches, such as surfaces of potential
  • Outline the likely effects on analysis results of variations in the kernel function used and the bandwidth adopted
  • Explain why and how density estimation transforms point data into a field representation
  • Explain why, in some cases, an adaptive bandwidth might be employed
  • Create density maps from point datasets using kernels and density estimation techniques using standard software
  • Differentiate between kernel density estimation and spatial interpolation
AM-07 - Point pattern analysis
  • List the conditions that make point pattern analysis a suitable process
  • Identify the various ways point patterns may be described
  • Identify various types of K-function analysis
  • Describe how Independent Random Process/Chi-Squared Result (IRP/CSR) may be used to make statistical statements about point patterns
  • Outline measures of pattern based on first and second order properties such as the mean center and standard distance, quadrat counts, nearest neighbor distance, and the more modern G, F, and K functions
  • Outline the basis of classic critiques of spatial statistical analysis in the context of point pattern analysis
  • Explain how distance-based methods of point pattern measurement can be derived from a distance matrix
  • Explain how proximity polygons (e.g., Thiessen polygons) may be used to describe point patterns
  • Explain how the K function provides a scale-dependent measure of dispersion
  • Compute measures of overall dispersion and clustering of point datasets using nearest neighbor distance statistics
AM-14 - Spatial process models
  • Discuss the relationship between spatial processes and spatial patterns
  • Differentiate between deterministic and stochastic spatial process models
  • Describe a simple process model that would generate a given set of spatial patterns
AM-13 - Multi-criteria evaluation
  • Describe the implementation of an ordered weighting scheme in a multiple-criteria aggregation
  • Compare and contrast the terms multi-criteria evaluation, weighted linear combination, and site suitability analysis
  • Differentiate between contributing factors and constraints in a multi-criteria application
  • Explain the legacy of multi-criteria evaluation in relation to cartographic modeling
  • Determine which method to use to combine criteria (e.g., linear, multiplication)
  • Create initial weights using the analytical hierarchy process (AHP)
  • Calibrate a linear combination model by adjusting weights using a test data set
AM-12 - Cartographic modeling
  • Describe the difference between prescriptive and descriptive cartographic models
  • Develop a flowchart of a cartographic model for a site suitability problem
  • Discuss the origins of cartographic modeling with reference to the work of Ian McHarg
AM-10 - Spatial Interaction

Spatial interaction (SI) is a fundamental concept in the GIScience literature, and may be defined in numerous ways. SI often describes the "flow" of individuals, commodities, capital, and information over (geographic) space resulting from a decision process. Alternatively, SI is sometimes used to refer to the influence of spatial proximity of places on the intensity of relations between those places. SI modeling as a separate research endeavor developed out of a need to mathematically model and understand the underlying determinants of these flows/influences. Proponents of SI modeling include economic geographers, regional scientists, and regional planners, as well as climate scientists, physicists, animal ecologists, and even some biophysical/environmental researchers. Originally developed from theories of interacting particles and gravitational forces in physics, SI modeling has developed through a series of refinements in terms of functional form, conceptual representations of distances, as well as a range of analytically rigorous technical improvements.
 

AM-09 - Cluster analysis
  • Identify several cluster detection techniques and discuss their limitations
  • Demonstrate the extension of spatial clustering to deal with clustering in space-time using the Know and Mantel tests
  • Perform a cluster detection analysis to detect “hot spots” in a point pattern
  • Discuss the characteristics of the various cluster detection techniques
AM-08 - Kernels and density estimation
  • Describe the relationships between kernels and classical spatial interaction approaches, such as surfaces of potential
  • Outline the likely effects on analysis results of variations in the kernel function used and the bandwidth adopted
  • Explain why and how density estimation transforms point data into a field representation
  • Explain why, in some cases, an adaptive bandwidth might be employed
  • Create density maps from point datasets using kernels and density estimation techniques using standard software
  • Differentiate between kernel density estimation and spatial interpolation

Pages