cognition

CV-16 - Virtual and Immersive Environments

A virtual environment (VE) is a 3D computer-based simulation of a real or imagined environment in which users can navigate and interactive with virtual objects. VEs have found popular use in communicating geographic information for a variety of domain applications. This entry begins with a brief history of virtual and immersive environments and an introduction to a common framework used to describe characteristics of VEs. Four design considerations for VEs then are reviewed: cognitive, methodological, social, and technological. The cognitive dimension involves generating a strong sense of presence for users in a VE, enabling users to perceive and study represented data in both virtual and real environments. The methodological dimension covers methods in collecting, processing, and visualizing data for VEs. The technological dimension surveys different VE hardware devices (input, computing, and output devices) and software tools (desktop and web technologies). Finally, the social dimension captures existing use cases for VEs in geo-related fields, such as geography education, spatial decision support, and crisis management.

CV-12 - Multivariate Mapping
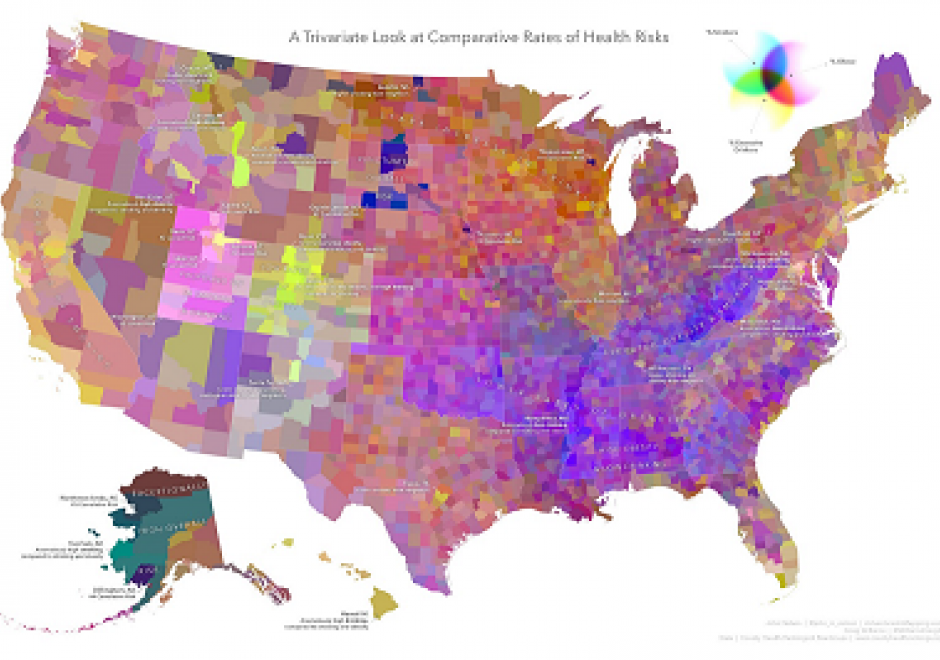
Bivariate and multivariate maps encode two or more data variables concurrently into a single symbolization mechanism. Their purpose is to reveal and communicate relationships between the variables that might not otherwise be apparent via a standard single-variable technique. These maps are inherently more complex, though offer a novel means of visualizing the nuances that may exist between the mapped variables. As information-dense visual products, they can require considerable effort on behalf of the map reader, though a thoughtfully-designed map and legend can be an interesting opportunity to effectively convey a comparative dimension.

This chapter describes some of the key types of bivariate and multivariate maps, walks through some of the rationale for various techniques, and encourages the reader to take an informed, balanced approach to map design weighing information density and visual complexity. Some alternatives to bivariate and multivariate mapping are provided, and their relative merits are discussed.

FC-04 - Perception and Cognitive Processing of Geographic Phenomena: a Choropleth Map Case Study

The near ubiquity of maps has created a population the is well adept at reading and understanding maps.  But, while maps are familiar, understanding how the human brain processes that information is less known.  Discussing the processing of geographic phenomena could take different avenues: specific geospatial thinking skills, general perception and cognition processes, or even different parts of the human brain that are invoked when thinking geographically.  This entry focuses on tracing the processing of geographic phenomena using a choropleth map case study, beginning from perception — the moment the phenomena enter the human brain via our senses, to cognition — how meaning and understanding are generated. 

CV-28 - Lesson Design in Cartography Education

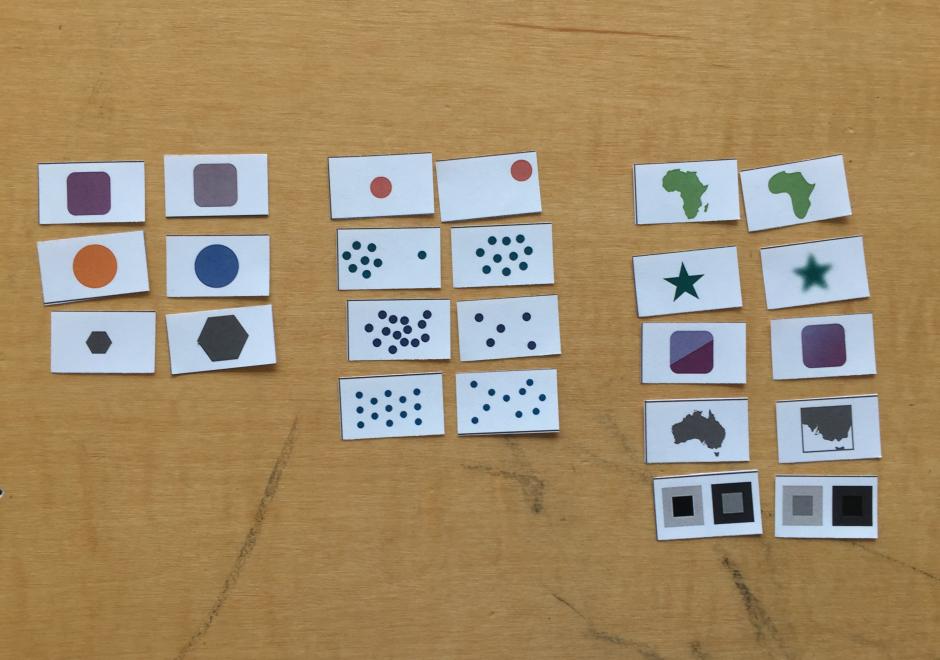
This entry describes six general variables of lesson design in cartography education and offers some practical advice for the development of materials for teaching cartography. First, a lesson’s scope concerns the set of ideas included in a lesson and helps identify different types of lessons based on the kinds of knowledge that they contain. Second, learning objectives concern the things that students should be able to do following a lesson and relate to different cognitive processes of learning. Third, a lesson’s scheme deals with the organizational framework for delivering content. Fourth, a lesson’s guidance concerns the amount and quality of supportive information provided. Fifth, a lesson’s sequence may involve one or more strategies for ordering content. Sixth, a lesson’s activity concerns what students do during a lesson and is often associated with different learning outcomes. These six variables help differentiate traditions for teaching cartography, elucidate some of the recurring challenges in cartography education, and offer strategies for designing lessons to foster meaningful learning outcomes.

CV-12 - Multivariate Mapping

Bivariate and multivariate maps encode two or more data variables concurrently into a single symbolization mechanism. Their purpose is to reveal and communicate relationships between the variables that might not otherwise be apparent via a standard single-variable technique. These maps are inherently more complex, though offer a novel means of visualizing the nuances that may exist between the mapped variables. As information-dense visual products, they can require considerable effort on behalf of the map reader, though a thoughtfully-designed map and legend can be an interesting opportunity to effectively convey a comparative dimension.

This chapter describes some of the key types of bivariate and multivariate maps, walks through some of the rationale for various techniques, and encourages the reader to take an informed, balanced approach to map design weighing information density and visual complexity. Some alternatives to bivariate and multivariate mapping are provided, and their relative merits are discussed.
CV-16 - Virtual and Immersive Environments

A virtual environment (VE) is a 3D computer-based simulation of a real or imagined environment in which users can navigate and interactive with virtual objects. VEs have found popular use in communicating geographic information for a variety of domain applications. This entry begins with a brief history of virtual and immersive environments and an introduction to a common framework used to describe characteristics of VEs. Four design considerations for VEs then are reviewed: cognitive, methodological, social, and technological. The cognitive dimension involves generating a strong sense of presence for users in a VE, enabling users to perceive and study represented data in both virtual and real environments. The methodological dimension covers methods in collecting, processing, and visualizing data for VEs. The technological dimension surveys different VE hardware devices (input, computing, and output devices) and software tools (desktop and web technologies). Finally, the social dimension captures existing use cases for VEs in geo-related fields, such as geography education, spatial decision support, and crisis management.

FC-04 - Perception and Cognitive Processing of Geographic Phenomena: a Choropleth Map Case Study

The near ubiquity of maps has created a population the is well adept at reading and understanding maps.  But, while maps are familiar, understanding how the human brain processes that information is less known.  Discussing the processing of geographic phenomena could take different avenues: specific geospatial thinking skills, general perception and cognition processes, or even different parts of the human brain that are invoked when thinking geographically.  This entry focuses on tracing the processing of geographic phenomena using a choropleth map case study, beginning from perception — the moment the phenomena enter the human brain via our senses, to cognition — how meaning and understanding are generated. 

CV-28 - Lesson Design in Cartography Education

This entry describes six general variables of lesson design in cartography education and offers some practical advice for the development of materials for teaching cartography. First, a lesson’s scope concerns the set of ideas included in a lesson and helps identify different types of lessons based on the kinds of knowledge that they contain. Second, learning objectives concern the things that students should be able to do following a lesson and relate to different cognitive processes of learning. Third, a lesson’s scheme deals with the organizational framework for delivering content. Fourth, a lesson’s guidance concerns the amount and quality of supportive information provided. Fifth, a lesson’s sequence may involve one or more strategies for ordering content. Sixth, a lesson’s activity concerns what students do during a lesson and is often associated with different learning outcomes. These six variables help differentiate traditions for teaching cartography, elucidate some of the recurring challenges in cartography education, and offer strategies for designing lessons to foster meaningful learning outcomes.

CV-12 - Multivariate Mapping

Bivariate and multivariate maps encode two or more data variables concurrently into a single symbolization mechanism. Their purpose is to reveal and communicate relationships between the variables that might not otherwise be apparent via a standard single-variable technique. These maps are inherently more complex, though offer a novel means of visualizing the nuances that may exist between the mapped variables. As information-dense visual products, they can require considerable effort on behalf of the map reader, though a thoughtfully-designed map and legend can be an interesting opportunity to effectively convey a comparative dimension.

This chapter describes some of the key types of bivariate and multivariate maps, walks through some of the rationale for various techniques, and encourages the reader to take an informed, balanced approach to map design weighing information density and visual complexity. Some alternatives to bivariate and multivariate mapping are provided, and their relative merits are discussed.
CV-16 - Virtual and Immersive Environments

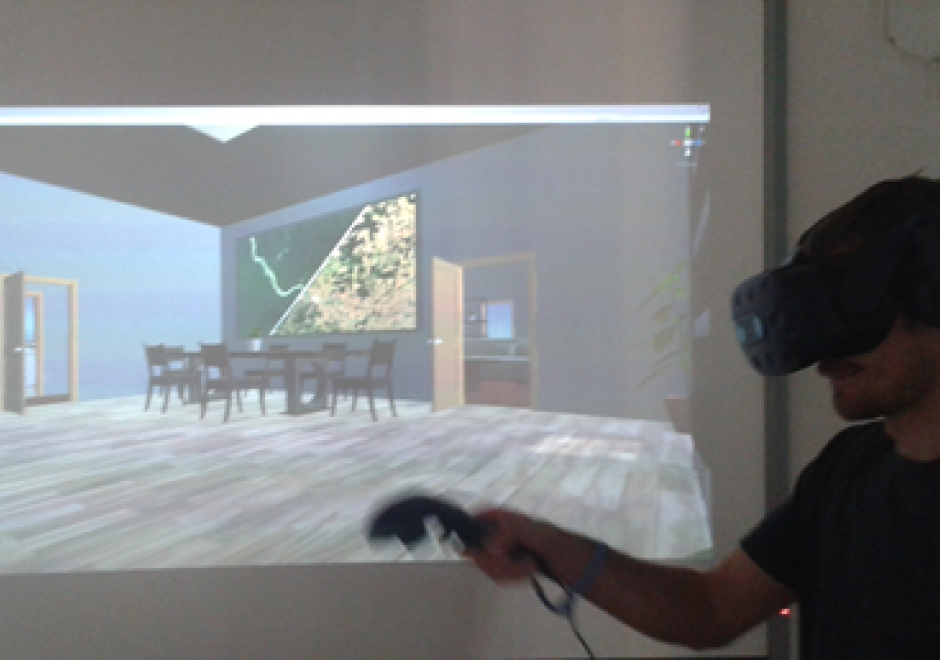
A virtual environment (VE) is a 3D computer-based simulation of a real or imagined environment in which users can navigate and interactive with virtual objects. VEs have found popular use in communicating geographic information for a variety of domain applications. This entry begins with a brief history of virtual and immersive environments and an introduction to a common framework used to describe characteristics of VEs. Four design considerations for VEs then are reviewed: cognitive, methodological, social, and technological. The cognitive dimension involves generating a strong sense of presence for users in a VE, enabling users to perceive and study represented data in both virtual and real environments. The methodological dimension covers methods in collecting, processing, and visualizing data for VEs. The technological dimension surveys different VE hardware devices (input, computing, and output devices) and software tools (desktop and web technologies). Finally, the social dimension captures existing use cases for VEs in geo-related fields, such as geography education, spatial decision support, and crisis management.

Pages