geostatistics

AM-27 - Principles of semi-variogram construction
  • Identify and define the parameters of a semi-variogram (range, sill, nugget)
  • Demonstrate how semi-variograms react to spatial nonstationarity
  • Construct a semi-variogram and illustrate with a semi-variogram cloud
  • Describe the relationships between semi-variograms and correlograms, and Moran’s indices of spatial association
AM-29 - Kriging Interpolation
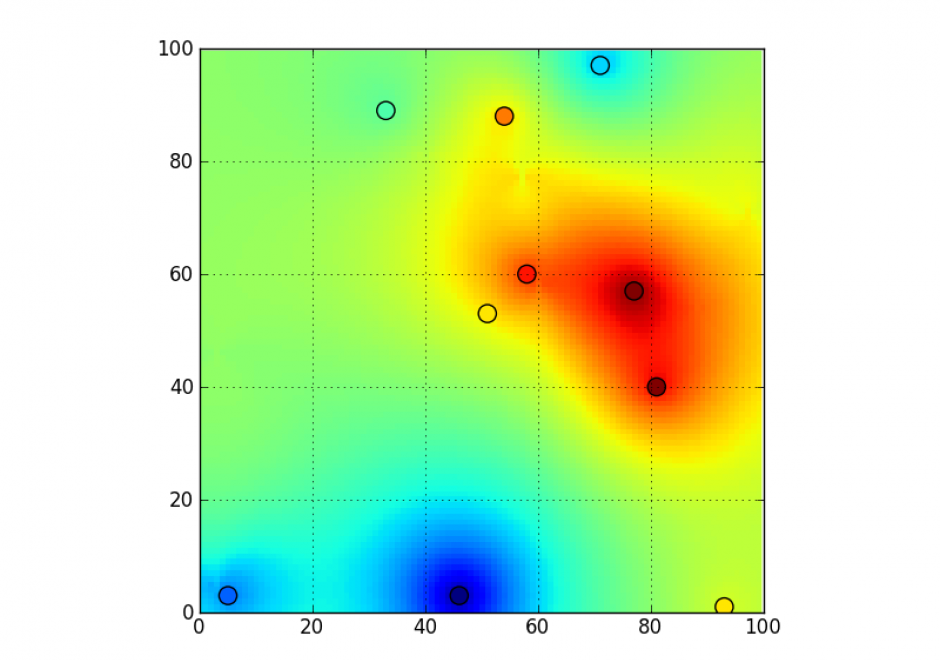
Kriging is an interpolation method that makes predictions at unsampled locations using a linear combination of observations at nearby sampled locations. The influence of each observation on the kriging prediction is based on several factors: 1) its geographical proximity to the unsampled location, 2) the spatial arrangement of all observations (i.e., data configuration, such as clustering of observations in oversampled areas), and 3) the pattern of spatial correlation of the data. The development of kriging models is meaningful only when data are spatially correlated.. Kriging has several advantages over traditional interpolation techniques, such as inverse distance weighting or nearest neighbor: 1) it provides a measure of uncertainty attached to the results (i.e., kriging variance); 2) it accounts for direction-dependent relationships (i.e., spatial anisotropy); 3) weights are assigned to observations based on the spatial correlation of data instead of assumptions made by the analyst for IDW; 4) kriging predictions are not constrained to the range of observations used for interpolation, and 5) data measured over different spatial supports can be combined and change of support, such as downscaling or upscaling, can be conducted.

AM-28 - Semi-variogram modeling
  • List the possible sources of error in a selected and fitted model of an experimental semi-variogram
  • Describe the conditions under which each of the commonly used semi-variograms models would be most appropriate
  • Explain the necessity of defining a semi-variogram model for geographic data
  • Apply the method of weighted least squares and maximum likelihood to fit semi-variogram models to datasets
  • Describe some commonly used semi-variogram models
AM-27 - Principles of semi-variogram construction
  • Identify and define the parameters of a semi-variogram (range, sill, nugget)
  • Demonstrate how semi-variograms react to spatial nonstationarity
  • Construct a semi-variogram and illustrate with a semi-variogram cloud
  • Describe the relationships between semi-variograms and correlograms, and Moran’s indices of spatial association
AM-29 - Kriging Interpolation

Kriging is an interpolation method that makes predictions at unsampled locations using a linear combination of observations at nearby sampled locations. The influence of each observation on the kriging prediction is based on several factors: 1) its geographical proximity to the unsampled location, 2) the spatial arrangement of all observations (i.e., data configuration, such as clustering of observations in oversampled areas), and 3) the pattern of spatial correlation of the data. The development of kriging models is meaningful only when data are spatially correlated.. Kriging has several advantages over traditional interpolation techniques, such as inverse distance weighting or nearest neighbor: 1) it provides a measure of uncertainty attached to the results (i.e., kriging variance); 2) it accounts for direction-dependent relationships (i.e., spatial anisotropy); 3) weights are assigned to observations based on the spatial correlation of data instead of assumptions made by the analyst for IDW; 4) kriging predictions are not constrained to the range of observations used for interpolation, and 5) data measured over different spatial supports can be combined and change of support, such as downscaling or upscaling, can be conducted.
AM-28 - Semi-variogram modeling
  • List the possible sources of error in a selected and fitted model of an experimental semi-variogram
  • Describe the conditions under which each of the commonly used semi-variograms models would be most appropriate
  • Explain the necessity of defining a semi-variogram model for geographic data
  • Apply the method of weighted least squares and maximum likelihood to fit semi-variogram models to datasets
  • Describe some commonly used semi-variogram models
AM-29 - Kriging Interpolation

Kriging is an interpolation method that makes predictions at unsampled locations using a linear combination of observations at nearby sampled locations. The influence of each observation on the kriging prediction is based on several factors: 1) its geographical proximity to the unsampled location, 2) the spatial arrangement of all observations (i.e., data configuration, such as clustering of observations in oversampled areas), and 3) the pattern of spatial correlation of the data. The development of kriging models is meaningful only when data are spatially correlated.. Kriging has several advantages over traditional interpolation techniques, such as inverse distance weighting or nearest neighbor: 1) it provides a measure of uncertainty attached to the results (i.e., kriging variance); 2) it accounts for direction-dependent relationships (i.e., spatial anisotropy); 3) weights are assigned to observations based on the spatial correlation of data instead of assumptions made by the analyst for IDW; 4) kriging predictions are not constrained to the range of observations used for interpolation, and 5) data measured over different spatial supports can be combined and change of support, such as downscaling or upscaling, can be conducted.

AM-27 - Principles of semi-variogram construction
  • Identify and define the parameters of a semi-variogram (range, sill, nugget)
  • Demonstrate how semi-variograms react to spatial nonstationarity
  • Construct a semi-variogram and illustrate with a semi-variogram cloud
  • Describe the relationships between semi-variograms and correlograms, and Moran’s indices of spatial association
AM-28 - Semi-variogram modeling
  • List the possible sources of error in a selected and fitted model of an experimental semi-variogram
  • Describe the conditions under which each of the commonly used semi-variograms models would be most appropriate
  • Explain the necessity of defining a semi-variogram model for geographic data
  • Apply the method of weighted least squares and maximum likelihood to fit semi-variogram models to datasets
  • Describe some commonly used semi-variogram models

Pages