geovisualization

CV-36 - Geovisual Analytics

Geovisual analytics refers to the science of analytical reasoning with spatial information as facilitated by interactive visual interfaces. It is distinguished by its focus on novel approaches to analysis rather than novel approaches to visualization or computational methods alone. As a result, geovisual analytics is usually grounded in real-world problem solving contexts. Research in geovisual analytics may focus on the development of new computational approaches to identify or predict patterns, new visual interfaces to geographic data, or new insights into the cognitive and perceptual processes that users apply to solve complex analytical problems. Systems for geovisual analytics typically feature a high-degree of user-driven interactivity and multiple visual representation types for spatial data. Geovisual analytics tools have been developed for a variety of problem scenarios, such as crisis management and disease epidemiology. Looking ahead, the emergence of new spatial data sources and display formats is expected to spur an expanding set of research and application needs for the foreseeable future. 

CV-35 - Geovisualization
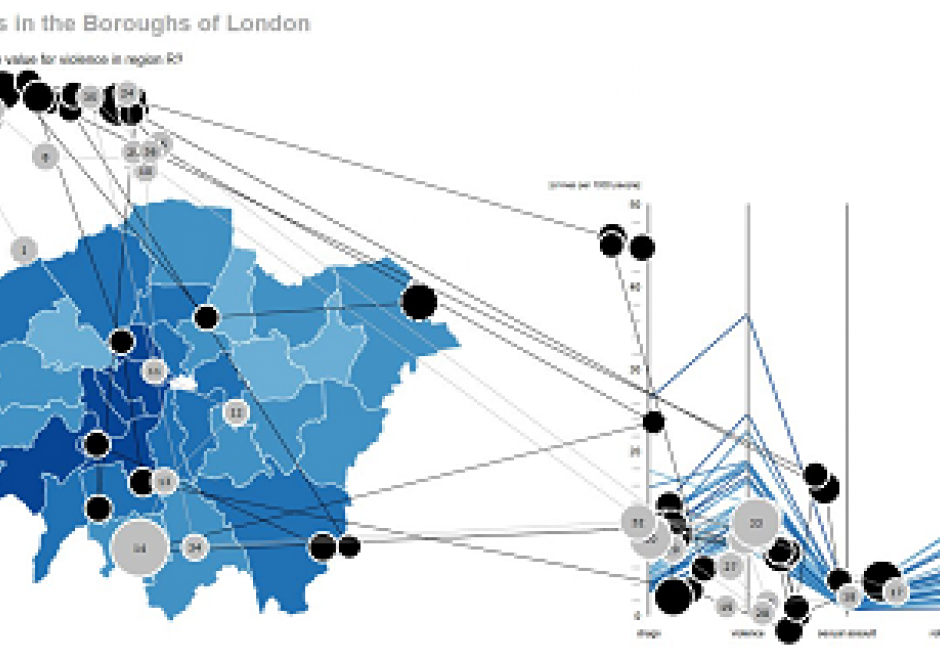
Geovisualization is primarily understood as the process of interactively visualizing geographic information in any of the steps in spatial analyses, even though it can also refer to the visual output (e.g., plots, maps, combinations of these), or the associated techniques. Rooted in cartography, geovisualization emerged as a research thrust with the leadership of Alan MacEachren (Pennsylvania State University) and colleagues when interactive maps and digitally-enabled exploratory data analysis led to a paradigm shift in 1980s and 1990s. A core argument for geovisualization is that visual thinking using maps is integral to the scientific process and hypothesis generation, and the role of maps grew beyond communicating the end results of an analysis or documentation process. As such, geovisualization interacts with a number of disciplines including cartography, visual analytics, information visualization, scientific visualization, statistics, computer science, art-and-design, and cognitive science; borrowing from and contributing to each. In this entry, we provide a definition and a brief history of geovisualization including its fundamental concepts, elaborate on its relationship to other disciplines, and briefly review the skills/tools that are relevant in working with geovisualization environments. We finish the entry with a list of learning objectives, instructional questions, and additional resources.

CV-19 - Big Data Visualization

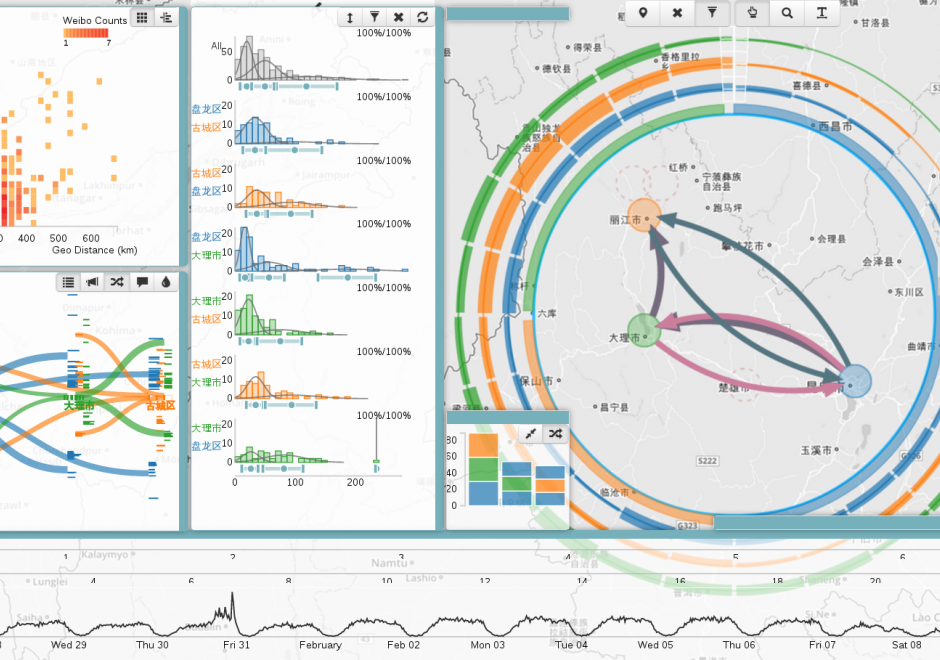
As new information and communication technologies have altered so many aspects of our daily lives over the past decades, they have simultaneously stimulated a shift in the types of data that we collect, produce, and analyze. Together, this changing data landscape is often referred to as "big data." Big data is distinguished from "small data" not only by its high volume but also by the velocity, variety, exhaustivity, resolution, relationality, and flexibility of the datasets. This entry discusses the visualization of big spatial datasets. As many such datasets contain geographic attributes or are situated and produced within geographic space, cartography takes on a pivotal role in big data visualization. Visualization of big data is frequently and effectively used to communicate and present information, but it is in making sense of big data – generating new insights and knowledge – that visualization is becoming an indispensable tool, making cartography vital to understanding geographic big data. Although visualization of big data presents several challenges, human experts can use visualization in general, and cartography in particular, aided by interfaces and software designed for this purpose, to effectively explore and analyze big data.

CV-35 - Geovisualization

Geovisualization is primarily understood as the process of interactively visualizing geographic information in any of the steps in spatial analyses, even though it can also refer to the visual output (e.g., plots, maps, combinations of these), or the associated techniques. Rooted in cartography, geovisualization emerged as a research thrust with the leadership of Alan MacEachren (Pennsylvania State University) and colleagues when interactive maps and digitally-enabled exploratory data analysis led to a paradigm shift in 1980s and 1990s. A core argument for geovisualization is that visual thinking using maps is integral to the scientific process and hypothesis generation, and the role of maps grew beyond communicating the end results of an analysis or documentation process. As such, geovisualization interacts with a number of disciplines including cartography, visual analytics, information visualization, scientific visualization, statistics, computer science, art-and-design, and cognitive science; borrowing from and contributing to each. In this entry, we provide a definition and a brief history of geovisualization including its fundamental concepts, elaborate on its relationship to other disciplines, and briefly review the skills/tools that are relevant in working with geovisualization environments. We finish the entry with a list of learning objectives, instructional questions, and additional resources.
CV-36 - Geovisual Analytics

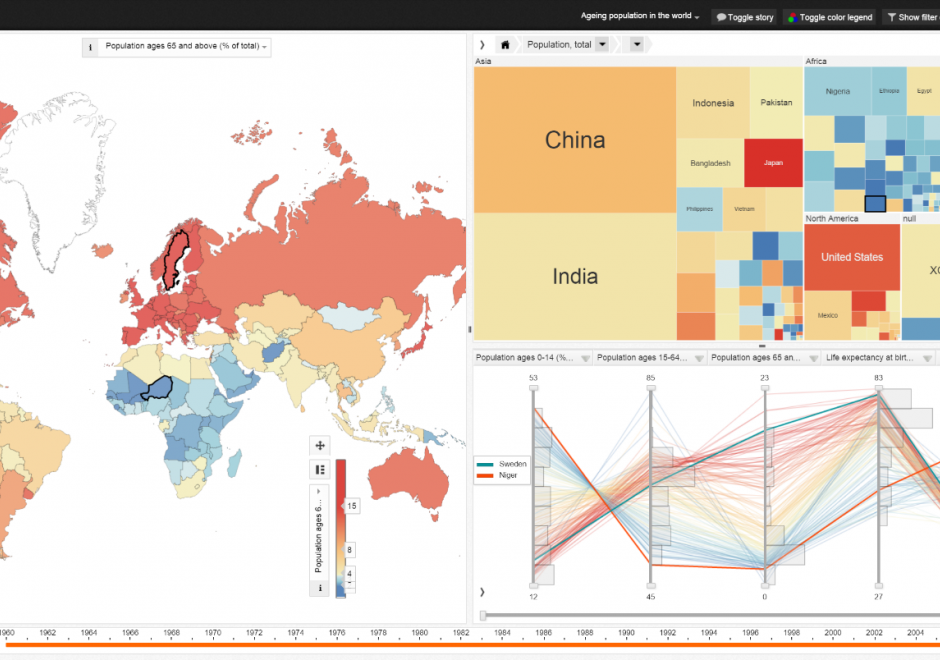
Geovisual analytics refers to the science of analytical reasoning with spatial information as facilitated by interactive visual interfaces. It is distinguished by its focus on novel approaches to analysis rather than novel approaches to visualization or computational methods alone. As a result, geovisual analytics is usually grounded in real-world problem solving contexts. Research in geovisual analytics may focus on the development of new computational approaches to identify or predict patterns, new visual interfaces to geographic data, or new insights into the cognitive and perceptual processes that users apply to solve complex analytical problems. Systems for geovisual analytics typically feature a high-degree of user-driven interactivity and multiple visual representation types for spatial data. Geovisual analytics tools have been developed for a variety of problem scenarios, such as crisis management and disease epidemiology. Looking ahead, the emergence of new spatial data sources and display formats is expected to spur an expanding set of research and application needs for the foreseeable future. 

CV-19 - Big Data Visualization

As new information and communication technologies have altered so many aspects of our daily lives over the past decades, they have simultaneously stimulated a shift in the types of data that we collect, produce, and analyze. Together, this changing data landscape is often referred to as "big data." Big data is distinguished from "small data" not only by its high volume but also by the velocity, variety, exhaustivity, resolution, relationality, and flexibility of the datasets. This entry discusses the visualization of big spatial datasets. As many such datasets contain geographic attributes or are situated and produced within geographic space, cartography takes on a pivotal role in big data visualization. Visualization of big data is frequently and effectively used to communicate and present information, but it is in making sense of big data – generating new insights and knowledge – that visualization is becoming an indispensable tool, making cartography vital to understanding geographic big data. Although visualization of big data presents several challenges, human experts can use visualization in general, and cartography in particular, aided by interfaces and software designed for this purpose, to effectively explore and analyze big data.

CV-36 - Geovisual Analytics

Geovisual analytics refers to the science of analytical reasoning with spatial information as facilitated by interactive visual interfaces. It is distinguished by its focus on novel approaches to analysis rather than novel approaches to visualization or computational methods alone. As a result, geovisual analytics is usually grounded in real-world problem solving contexts. Research in geovisual analytics may focus on the development of new computational approaches to identify or predict patterns, new visual interfaces to geographic data, or new insights into the cognitive and perceptual processes that users apply to solve complex analytical problems. Systems for geovisual analytics typically feature a high-degree of user-driven interactivity and multiple visual representation types for spatial data. Geovisual analytics tools have been developed for a variety of problem scenarios, such as crisis management and disease epidemiology. Looking ahead, the emergence of new spatial data sources and display formats is expected to spur an expanding set of research and application needs for the foreseeable future. 

CV-35 - Geovisualization

Geovisualization is primarily understood as the process of interactively visualizing geographic information in any of the steps in spatial analyses, even though it can also refer to the visual output (e.g., plots, maps, combinations of these), or the associated techniques. Rooted in cartography, geovisualization emerged as a research thrust with the leadership of Alan MacEachren (Pennsylvania State University) and colleagues when interactive maps and digitally-enabled exploratory data analysis led to a paradigm shift in 1980s and 1990s. A core argument for geovisualization is that visual thinking using maps is integral to the scientific process and hypothesis generation, and the role of maps grew beyond communicating the end results of an analysis or documentation process. As such, geovisualization interacts with a number of disciplines including cartography, visual analytics, information visualization, scientific visualization, statistics, computer science, art-and-design, and cognitive science; borrowing from and contributing to each. In this entry, we provide a definition and a brief history of geovisualization including its fundamental concepts, elaborate on its relationship to other disciplines, and briefly review the skills/tools that are relevant in working with geovisualization environments. We finish the entry with a list of learning objectives, instructional questions, and additional resources.

CV-19 - Big Data Visualization

As new information and communication technologies have altered so many aspects of our daily lives over the past decades, they have simultaneously stimulated a shift in the types of data that we collect, produce, and analyze. Together, this changing data landscape is often referred to as "big data." Big data is distinguished from "small data" not only by its high volume but also by the velocity, variety, exhaustivity, resolution, relationality, and flexibility of the datasets. This entry discusses the visualization of big spatial datasets. As many such datasets contain geographic attributes or are situated and produced within geographic space, cartography takes on a pivotal role in big data visualization. Visualization of big data is frequently and effectively used to communicate and present information, but it is in making sense of big data – generating new insights and knowledge – that visualization is becoming an indispensable tool, making cartography vital to understanding geographic big data. Although visualization of big data presents several challenges, human experts can use visualization in general, and cartography in particular, aided by interfaces and software designed for this purpose, to effectively explore and analyze big data.

CV-36 - Geovisual Analytics

Geovisual analytics refers to the science of analytical reasoning with spatial information as facilitated by interactive visual interfaces. It is distinguished by its focus on novel approaches to analysis rather than novel approaches to visualization or computational methods alone. As a result, geovisual analytics is usually grounded in real-world problem solving contexts. Research in geovisual analytics may focus on the development of new computational approaches to identify or predict patterns, new visual interfaces to geographic data, or new insights into the cognitive and perceptual processes that users apply to solve complex analytical problems. Systems for geovisual analytics typically feature a high-degree of user-driven interactivity and multiple visual representation types for spatial data. Geovisual analytics tools have been developed for a variety of problem scenarios, such as crisis management and disease epidemiology. Looking ahead, the emergence of new spatial data sources and display formats is expected to spur an expanding set of research and application needs for the foreseeable future. 

Pages