Python

PD-28 - Visual Programming for GIS Applications

Visual programming languages (VPLs) in GIS applications are used to design the automatic processing of spatial data in an easy visual form. The resulted visual workflow is useful when the same processing steps need to be repeated on different spatial data (e.g. other areas, another period). In the case of visual programming languages, simple graphical symbols represent spatial operations implemented in GIS software (tools, geoalgorithms). Users can create a sequence of operation in a simple visual form, like a chain of graphical symbols. Visual programs can be stored and reused. The graphical form is useful to non-programmers who are not familiar with a textual programming language, as is the case with many professionals such as urban planners, facility managers, ecologists and other users of GIS. VPLs are implemented not only in GIS applications but also in remote sensing (RS) applications. Sometimes both types of applications are bundled together in one geospatial application that offers geoalgorithms in a shared VPL environment. Visual programming languages are an integral part of software engineering (SE). Data flow and workflow diagrams are one of the oldest graphical representations in informatics.

PD-31 - PySAL and Spatial Statistics Libraries
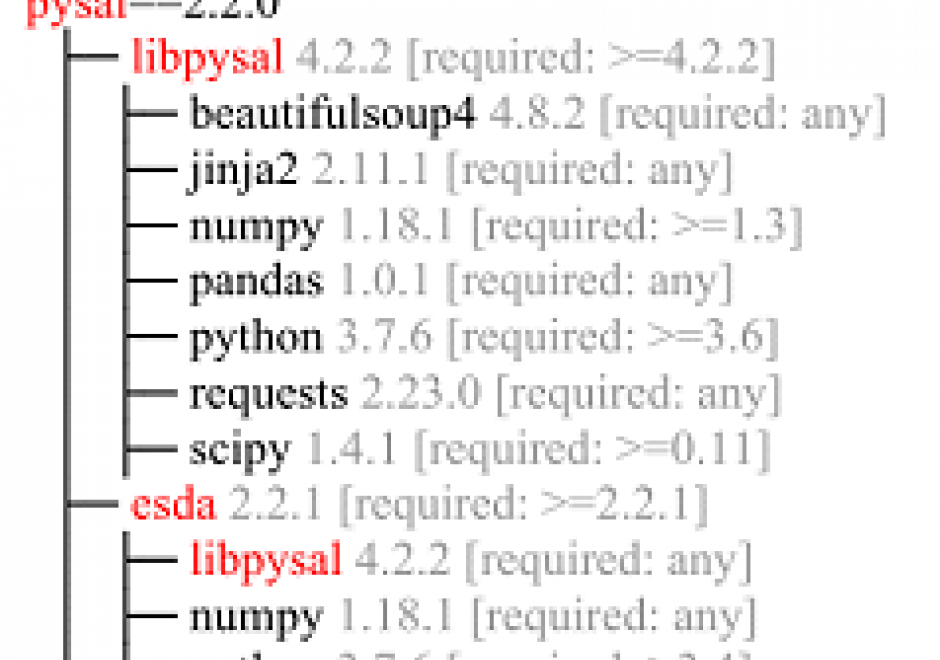
As spatial statistics are essential to the geographical inquiry, accessible and flexible software offering relevant functionalities is highly desired. Python Spatial Analysis Library (PySAL) represents an endeavor towards this end. It is an open-source python library and ecosystem hosting a wide array of spatial statistical and visualization methods. Since its first public release in 2010, PySAL has been applied to address various research questions, used as teaching materials for pedagogical purposes in regular classes and conference workshops serving a wide audience, and integrated into general GIS software such as ArcGIS and QGIS. This entry first gives an overview of the history and new development with PySAL. This is followed by a discussion of PySAL’s new hierarchical structure, and two different modes of accessing PySAL’s functionalities to perform various spatial statistical tasks, including exploratory spatial data analysis, spatial regression, and geovisualization. Next, a discussion is provided on how to find and utilize useful materials for studying and using spatial statistical functions from PySAL and how to get involved with the PySAL community as a user and prospective developer. The entry ends with a brief discussion of future development with PySAL.

PD-28 - Visual Programming for GIS Applications

Visual programming languages (VPLs) in GIS applications are used to design the automatic processing of spatial data in an easy visual form. The resulted visual workflow is useful when the same processing steps need to be repeated on different spatial data (e.g. other areas, another period). In the case of visual programming languages, simple graphical symbols represent spatial operations implemented in GIS software (tools, geoalgorithms). Users can create a sequence of operation in a simple visual form, like a chain of graphical symbols. Visual programs can be stored and reused. The graphical form is useful to non-programmers who are not familiar with a textual programming language, as is the case with many professionals such as urban planners, facility managers, ecologists and other users of GIS. VPLs are implemented not only in GIS applications but also in remote sensing (RS) applications. Sometimes both types of applications are bundled together in one geospatial application that offers geoalgorithms in a shared VPL environment. Visual programming languages are an integral part of software engineering (SE). Data flow and workflow diagrams are one of the oldest graphical representations in informatics.

Pages