spatial analysis

PD-11 - Python for GIS

Figure 1. PySAL within QGIS Processing Toolbox: Hot-spot analysis of Homicide Rates in Southern US Counties.


Python is a popular language for geospatial programming and application development. This entry provides an overview of the different development modes that can be adopted for GIS programming with Python and discusses the history of Python adoption in the GIS community. The different layers of the geospatial development stack in Python are examined giving the reader an understanding of the breadth that Python offers to the GIS developer. Future developments and broader issues related to interoperability and programming ecosystems are identified.

AM-07 - Point Pattern Analysis
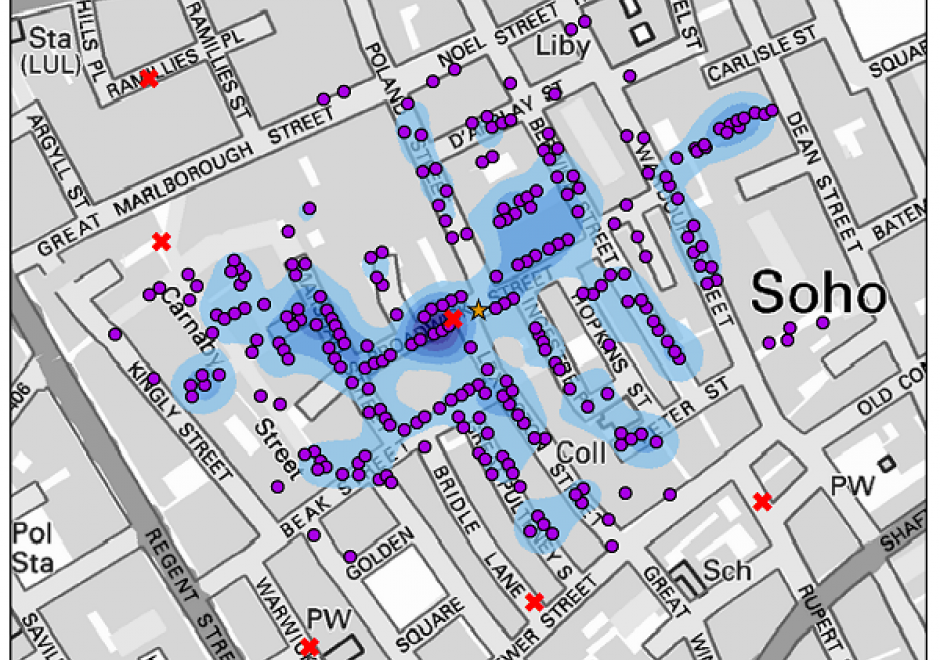
Point pattern analysis (PPA) focuses on the analysis, modeling, visualization, and interpretation of point data. With the increasing availability of big geo-data, such as mobile phone records and social media check-ins, more and more individual-level point data are generated daily. PPA provides an effective approach to analyzing the distribution of such data. This entry provides an overview of commonly used methods in PPA, as well as demonstrates the utility of these methods for scientific investigation based on a classic case study: the 1854 cholera outbreaks in London.

PD-11 - Python for GIS

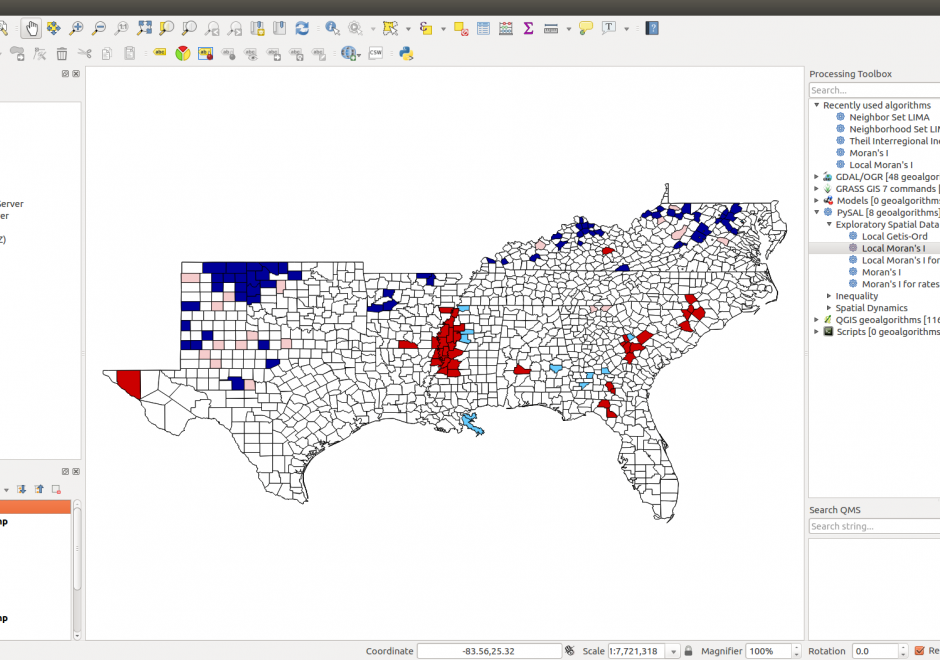
Figure 1. PySAL within QGIS Processing Toolbox: Hot-spot analysis of Homicide Rates in Southern US Counties.


Python is a popular language for geospatial programming and application development. This entry provides an overview of the different development modes that can be adopted for GIS programming with Python and discusses the history of Python adoption in the GIS community. The different layers of the geospatial development stack in Python are examined giving the reader an understanding of the breadth that Python offers to the GIS developer. Future developments and broader issues related to interoperability and programming ecosystems are identified.

PD-15 - R for Geospatial Analysis and Mapping

R is a programming language as well as a computing environment to perform a wide variety of data analysis, statistics, and visualization. One of the reasons for the popularity of R is that it embraces open, transparent scholarship and reproducible research. It is possible to combine content and code in one document, so data, analysis, and graphs are tied together into one narrative, which can be shared with others to recreate analyses and reevaluate interpretations. Different from tools like ArcGIS or QGIS that are specifically built for spatial data, GIS functionality is just one of many things R offers. And while users of dedicated GIS tools typically interact with the software via a point-and-click graphical interface, R requires command-line scripting. Many R users today rely on RStudio, an integrated development environment (IDE) that facilitates the writing of R code and comes with a series of convenient features, like integrated help, data viewer, code completion, and syntax coloring. By using R Markdown, a particular flavor of the Markdown language, RStudio also makes it particularly easy to create documents that embed and execute R code snippets within a text and to render both, static documents (like PDF), as well as interactive html pages, a feature particularly useful for exploratory GIS work and mapping.

AM-07 - Point Pattern Analysis

Point pattern analysis (PPA) focuses on the analysis, modeling, visualization, and interpretation of point data. With the increasing availability of big geo-data, such as mobile phone records and social media check-ins, more and more individual-level point data are generated daily. PPA provides an effective approach to analyzing the distribution of such data. This entry provides an overview of commonly used methods in PPA, as well as demonstrates the utility of these methods for scientific investigation based on a classic case study: the 1854 cholera outbreaks in London.
PD-15 - R for Geospatial Analysis and Mapping

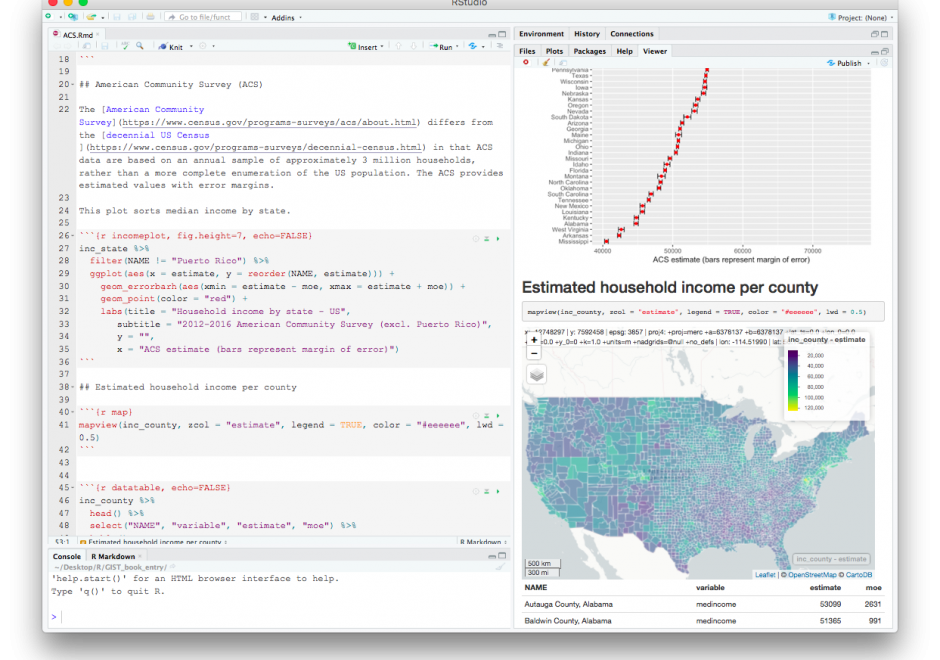
R is a programming language as well as a computing environment to perform a wide variety of data analysis, statistics, and visualization. One of the reasons for the popularity of R is that it embraces open, transparent scholarship and reproducible research. It is possible to combine content and code in one document, so data, analysis, and graphs are tied together into one narrative, which can be shared with others to recreate analyses and reevaluate interpretations. Different from tools like ArcGIS or QGIS that are specifically built for spatial data, GIS functionality is just one of many things R offers. And while users of dedicated GIS tools typically interact with the software via a point-and-click graphical interface, R requires command-line scripting. Many R users today rely on RStudio, an integrated development environment (IDE) that facilitates the writing of R code and comes with a series of convenient features, like integrated help, data viewer, code completion, and syntax coloring. By using R Markdown, a particular flavor of the Markdown language, RStudio also makes it particularly easy to create documents that embed and execute R code snippets within a text and to render both, static documents (like PDF), as well as interactive html pages, a feature particularly useful for exploratory GIS work and mapping.

PD-11 - Python for GIS

Figure 1. PySAL within QGIS Processing Toolbox: Hot-spot analysis of Homicide Rates in Southern US Counties.


Python is a popular language for geospatial programming and application development. This entry provides an overview of the different development modes that can be adopted for GIS programming with Python and discusses the history of Python adoption in the GIS community. The different layers of the geospatial development stack in Python are examined giving the reader an understanding of the breadth that Python offers to the GIS developer. Future developments and broader issues related to interoperability and programming ecosystems are identified.

AM-07 - Point Pattern Analysis

Point pattern analysis (PPA) focuses on the analysis, modeling, visualization, and interpretation of point data. With the increasing availability of big geo-data, such as mobile phone records and social media check-ins, more and more individual-level point data are generated daily. PPA provides an effective approach to analyzing the distribution of such data. This entry provides an overview of commonly used methods in PPA, as well as demonstrates the utility of these methods for scientific investigation based on a classic case study: the 1854 cholera outbreaks in London.

PD-11 - Python for GIS

Figure 1. PySAL within QGIS Processing Toolbox: Hot-spot analysis of Homicide Rates in Southern US Counties.


Python is a popular language for geospatial programming and application development. This entry provides an overview of the different development modes that can be adopted for GIS programming with Python and discusses the history of Python adoption in the GIS community. The different layers of the geospatial development stack in Python are examined giving the reader an understanding of the breadth that Python offers to the GIS developer. Future developments and broader issues related to interoperability and programming ecosystems are identified.

PD-15 - R for Geospatial Analysis and Mapping

R is a programming language as well as a computing environment to perform a wide variety of data analysis, statistics, and visualization. One of the reasons for the popularity of R is that it embraces open, transparent scholarship and reproducible research. It is possible to combine content and code in one document, so data, analysis, and graphs are tied together into one narrative, which can be shared with others to recreate analyses and reevaluate interpretations. Different from tools like ArcGIS or QGIS that are specifically built for spatial data, GIS functionality is just one of many things R offers. And while users of dedicated GIS tools typically interact with the software via a point-and-click graphical interface, R requires command-line scripting. Many R users today rely on RStudio, an integrated development environment (IDE) that facilitates the writing of R code and comes with a series of convenient features, like integrated help, data viewer, code completion, and syntax coloring. By using R Markdown, a particular flavor of the Markdown language, RStudio also makes it particularly easy to create documents that embed and execute R code snippets within a text and to render both, static documents (like PDF), as well as interactive html pages, a feature particularly useful for exploratory GIS work and mapping.

Pages