spatial autocorrelation

FC-27 - Thematic Accuracy Assessment

Geographic Information System (GIS) applications often involve various analytical techniques and geographic data to produce thematic maps for gaining a better understanding of geospatial situations to support spatial decisions. Accuracy assessment of a thematic map is necessary for evaluating the quality of the research results and ensuring appropriate use of the geographic data. Thematic accuracy deals with evaluating the accuracy of the attributes or labels of mapped features by comparing them to a reference that is assumed to be true. The fundamental practice presents the remote sensing approach to thematic accuracy assessment as a good guidance. For instance, the accuracy of a remote sensing image can be represented as an error matrix when the map and reference classification are conducted based on categories. This entry introduces basic concepts and techniques used in conducting thematic accuracy with an emphasis on land cover classification based on remote sensing images. The entry first introduces concepts of spatial uncertainty and spatial data quality standards and further gives an example of how spatial data quality affects thematic accuracy. Additionally, the entry illustrates the techniques that can be used to access thematic accuracy as well as using spatial autocorrelation in thematic accuracy sampling design.

AM-97 - An Introduction to Spatial Data Mining
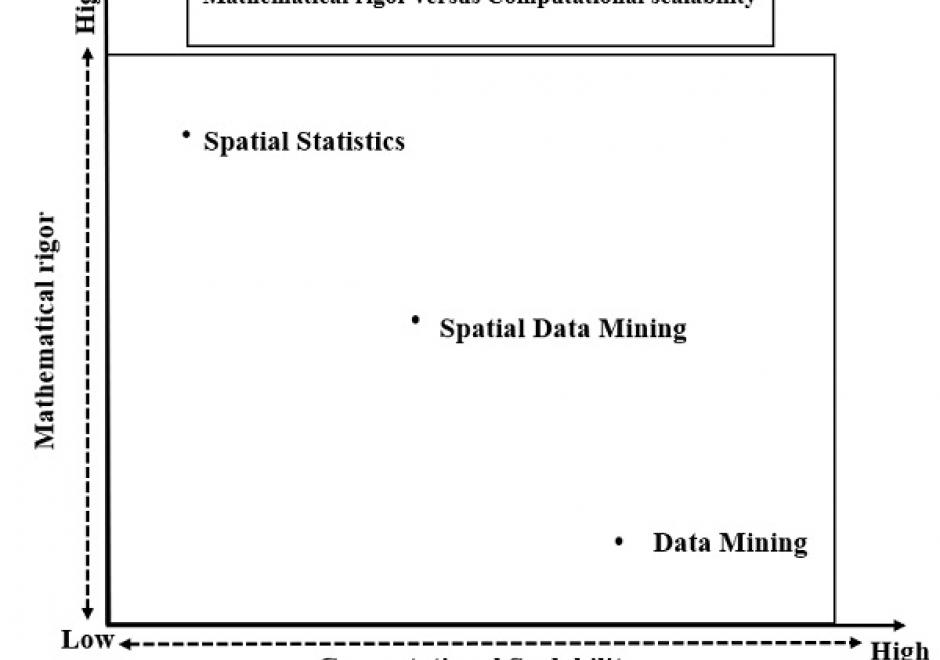
The goal of spatial data mining is to discover potentially useful, interesting, and non-trivial patterns from spatial data-sets (e.g., GPS trajectory of smartphones). Spatial data mining is societally important having applications in public health, public safety, climate science, etc. For example, in epidemiology, spatial data mining helps to nd areas with a high concentration of disease incidents to manage disease outbreaks. Computational methods are needed to discover spatial patterns since the volume and velocity of spatial data exceed the ability of human experts to analyze it. Spatial data has unique characteristics like spatial autocorrelation and spatial heterogeneity which violate the i.i.d (Independent and Identically Distributed) assumption of traditional statistic and data mining methods. Therefore, using traditional methods may miss patterns or may yield spurious patterns, which are costly in societal applications. Further, there are additional challenges such as MAUP (Modiable Areal Unit Problem) as illustrated by a recent court case debating gerrymandering in elections. In this article, we discuss tools and computational methods of spatial data mining, focusing on the primary spatial pattern families: hotspot detection, collocation detection, spatial prediction, and spatial outlier detection. Hotspot detection methods use domain information to accurately model more active and high-density areas. Collocation detection methods find objects whose instances are in proximity to each other in a location. Spatial prediction approaches explicitly model the neighborhood relationship of locations to predict target variables from input features. Finally, spatial outlier detection methods find data that differ from their neighbors. Lastly, we describe future research and trends in spatial data mining.

AM-22 - Global Measures of Spatial Association

Spatial association broadly describes how the locations and values of samples or observations vary across space. Similarity in both the attribute values and locations of observations can be assessed using measures of spatial association based upon the first law of geography. In this entry, we focus on the measures of spatial autocorrelation that assess the degree of similarity between attribute values of nearby observations across the entire study region. These global measures assess spatial relationships with the combination of spatial proximity as captured in the spatial weights matrix and the attribute similarity as captured by variable covariance (i.e. Moran’s I) or squared difference (i.e. Geary’s C). For categorical data, the join count statistic provides a global measure of spatial association. Two visualization approaches for spatial autocorrelation measures include Moran scatterplots and variograms (also known as semi-variograms).

FC-27 - Thematic Accuracy Assessment

Geographic Information System (GIS) applications often involve various analytical techniques and geographic data to produce thematic maps for gaining a better understanding of geospatial situations to support spatial decisions. Accuracy assessment of a thematic map is necessary for evaluating the quality of the research results and ensuring appropriate use of the geographic data. Thematic accuracy deals with evaluating the accuracy of the attributes or labels of mapped features by comparing them to a reference that is assumed to be true. The fundamental practice presents the remote sensing approach to thematic accuracy assessment as a good guidance. For instance, the accuracy of a remote sensing image can be represented as an error matrix when the map and reference classification are conducted based on categories. This entry introduces basic concepts and techniques used in conducting thematic accuracy with an emphasis on land cover classification based on remote sensing images. The entry first introduces concepts of spatial uncertainty and spatial data quality standards and further gives an example of how spatial data quality affects thematic accuracy. Additionally, the entry illustrates the techniques that can be used to access thematic accuracy as well as using spatial autocorrelation in thematic accuracy sampling design.

AM-97 - An Introduction to Spatial Data Mining

The goal of spatial data mining is to discover potentially useful, interesting, and non-trivial patterns from spatial data-sets (e.g., GPS trajectory of smartphones). Spatial data mining is societally important having applications in public health, public safety, climate science, etc. For example, in epidemiology, spatial data mining helps to nd areas with a high concentration of disease incidents to manage disease outbreaks. Computational methods are needed to discover spatial patterns since the volume and velocity of spatial data exceed the ability of human experts to analyze it. Spatial data has unique characteristics like spatial autocorrelation and spatial heterogeneity which violate the i.i.d (Independent and Identically Distributed) assumption of traditional statistic and data mining methods. Therefore, using traditional methods may miss patterns or may yield spurious patterns, which are costly in societal applications. Further, there are additional challenges such as MAUP (Modiable Areal Unit Problem) as illustrated by a recent court case debating gerrymandering in elections. In this article, we discuss tools and computational methods of spatial data mining, focusing on the primary spatial pattern families: hotspot detection, collocation detection, spatial prediction, and spatial outlier detection. Hotspot detection methods use domain information to accurately model more active and high-density areas. Collocation detection methods find objects whose instances are in proximity to each other in a location. Spatial prediction approaches explicitly model the neighborhood relationship of locations to predict target variables from input features. Finally, spatial outlier detection methods find data that differ from their neighbors. Lastly, we describe future research and trends in spatial data mining.
AM-22 - Global Measures of Spatial Association

Spatial association broadly describes how the locations and values of samples or observations vary across space. Similarity in both the attribute values and locations of observations can be assessed using measures of spatial association based upon the first law of geography. In this entry, we focus on the measures of spatial autocorrelation that assess the degree of similarity between attribute values of nearby observations across the entire study region. These global measures assess spatial relationships with the combination of spatial proximity as captured in the spatial weights matrix and the attribute similarity as captured by variable covariance (i.e. Moran’s I) or squared difference (i.e. Geary’s C). For categorical data, the join count statistic provides a global measure of spatial association. Two visualization approaches for spatial autocorrelation measures include Moran scatterplots and variograms (also known as semi-variograms).

FC-27 - Thematic Accuracy Assessment

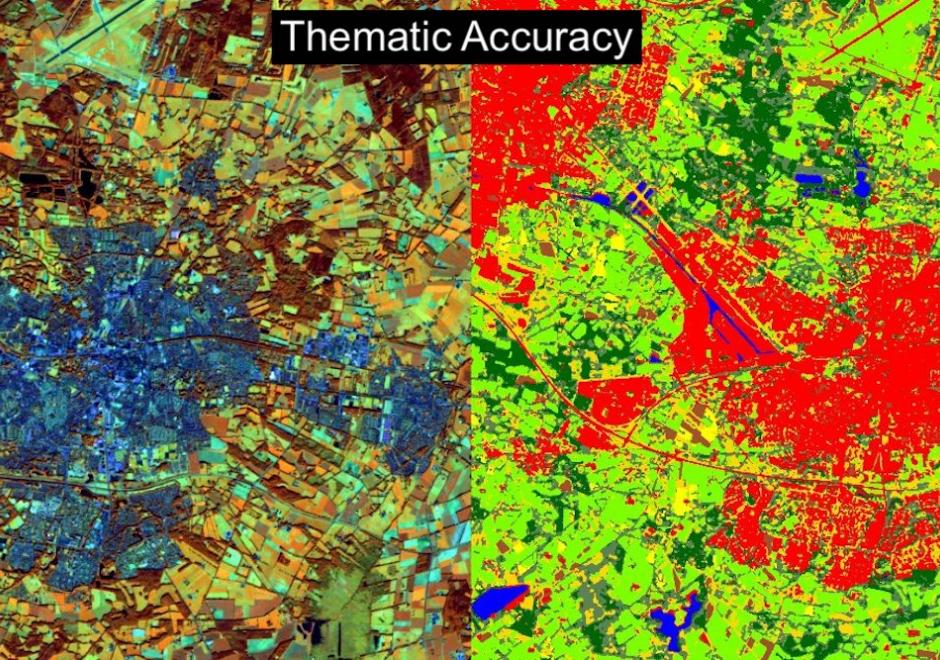
Geographic Information System (GIS) applications often involve various analytical techniques and geographic data to produce thematic maps for gaining a better understanding of geospatial situations to support spatial decisions. Accuracy assessment of a thematic map is necessary for evaluating the quality of the research results and ensuring appropriate use of the geographic data. Thematic accuracy deals with evaluating the accuracy of the attributes or labels of mapped features by comparing them to a reference that is assumed to be true. The fundamental practice presents the remote sensing approach to thematic accuracy assessment as a good guidance. For instance, the accuracy of a remote sensing image can be represented as an error matrix when the map and reference classification are conducted based on categories. This entry introduces basic concepts and techniques used in conducting thematic accuracy with an emphasis on land cover classification based on remote sensing images. The entry first introduces concepts of spatial uncertainty and spatial data quality standards and further gives an example of how spatial data quality affects thematic accuracy. Additionally, the entry illustrates the techniques that can be used to access thematic accuracy as well as using spatial autocorrelation in thematic accuracy sampling design.

Pages