spatial data management

GS-27 - GIS&T for Equity and Social Justice

A geographic information system (GIS) can be used effectively for activities, programs, and analyses focused on equity and social justice (ESJ).  Many types of inequities exist in society, but race and space are key predictors of inequity. A key concept of social justice is that any person born into society, no matter where they were born or live, will have an equitable opportunity to achieve successful life outcomes and to thrive. Geographic information science and its technologies (GIS&T) provide powerful tools to analyze equity and social justice issues and help government agencies apply an equity lens to every aspect of their administration. Given the reliance on spatial data to represent and analyze matters of ESJ, the use of these tools is necessary, logical, and appropriate. Some types of analyses and mapping commonly used with ESJ programs require careful attention to how data are combined and represented, risking misleading or false conclusions otherwise. Such outcomes could build mistrust when trust is most needed. A GIS-supported lifecycle for ESJ is presented that includes stages of exploratory issue analysis, community feedback, pro-equity programs analysis, management monitoring and stakeholder awareness, program performance metrics, and effectiveness analysis.

DM-71 - Geospatial Data Conflation

Spatial data conflation is the process of combining overlapping spatial datasets to produce a better dataset with higher accuracy or more information. Conflation is needed in many fields, ranging from transportation planning to the analysis of historical datasets, which require the use of multiple data sources. Geospatial data conflation becomes increasingly important with the advancement of GIS and the emergence of new sources of spatial data such as Volunteered Geographic Information.

Conceptually, conflation is a two-step process involving identifying counterpart features that correspond to the same object in reality, and merging the geometry and attributes of counterpart features. In practice, conflation can be performed either manually or with the aid of GIS with varying degrees of automation. Manual conflation is labor-intensive, time consuming and expensive. It is often adopted in practice, nonetheless, due to the lack of reliable automatic conflation methods.

A main challenge of automatic conflation lies in the automatic matching of corresponding features, due to the varying quality and different representations of map data. Many (semi-)automatic feature methods exist. They typically involve measuring the distance between each feature pair and trying to match feature pairs with smaller dissimilarity using a specially designed algorithm or model. Fully automated conflation is still an active research field.

DA-46 - Computational Geography

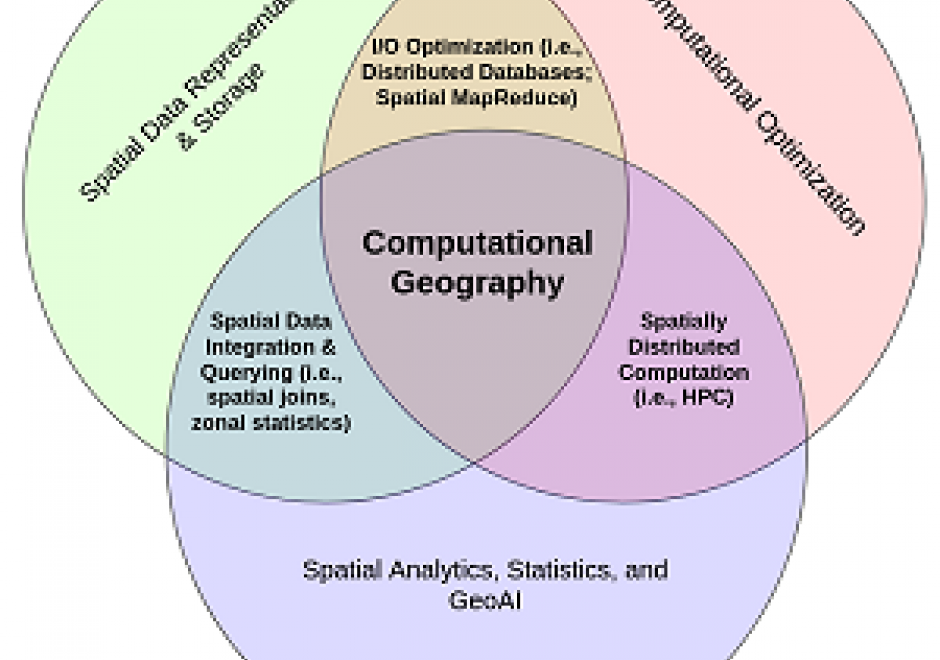
Computational Geography emerged in the 1980s in response to the reductionist limitations of early GIS software, which inhibited deep analyses of rich geographic data. Today, Computational Geography continues to integrate a wide range of domains to facilitate spatial analyses that require computational resources or ontological paradigms beyond that made available in traditional GIS software packages. These include novel approaches for the mass creation of geospatial data, large-scale database design for the effective storage and querying of spatial identifiers (i.e., distributed spatial databases), and methodologies which enable simulations and/or analysis in the context of large-scale, frequently near-real-time, spatially-explicit sources of information. The topics studied within Computational Geography directly enable many of the world’s largest public databases, including Google Maps and Open Street Map (OSM), as well as many modern analytic pipelines designed to study human behavior with the integration of large volumes of location information (e.g., mobile phone data) with other geospatial sources (e.g., satellite imagery).

GS-27 - GIS&T for Equity and Social Justice

A geographic information system (GIS) can be used effectively for activities, programs, and analyses focused on equity and social justice (ESJ).  Many types of inequities exist in society, but race and space are key predictors of inequity. A key concept of social justice is that any person born into society, no matter where they were born or live, will have an equitable opportunity to achieve successful life outcomes and to thrive. Geographic information science and its technologies (GIS&T) provide powerful tools to analyze equity and social justice issues and help government agencies apply an equity lens to every aspect of their administration. Given the reliance on spatial data to represent and analyze matters of ESJ, the use of these tools is necessary, logical, and appropriate. Some types of analyses and mapping commonly used with ESJ programs require careful attention to how data are combined and represented, risking misleading or false conclusions otherwise. Such outcomes could build mistrust when trust is most needed. A GIS-supported lifecycle for ESJ is presented that includes stages of exploratory issue analysis, community feedback, pro-equity programs analysis, management monitoring and stakeholder awareness, program performance metrics, and effectiveness analysis.

DM-71 - Geospatial Data Conflation

Spatial data conflation is the process of combining overlapping spatial datasets to produce a better dataset with higher accuracy or more information. Conflation is needed in many fields, ranging from transportation planning to the analysis of historical datasets, which require the use of multiple data sources. Geospatial data conflation becomes increasingly important with the advancement of GIS and the emergence of new sources of spatial data such as Volunteered Geographic Information.

Conceptually, conflation is a two-step process involving identifying counterpart features that correspond to the same object in reality, and merging the geometry and attributes of counterpart features. In practice, conflation can be performed either manually or with the aid of GIS with varying degrees of automation. Manual conflation is labor-intensive, time consuming and expensive. It is often adopted in practice, nonetheless, due to the lack of reliable automatic conflation methods.

A main challenge of automatic conflation lies in the automatic matching of corresponding features, due to the varying quality and different representations of map data. Many (semi-)automatic feature methods exist. They typically involve measuring the distance between each feature pair and trying to match feature pairs with smaller dissimilarity using a specially designed algorithm or model. Fully automated conflation is still an active research field.
DA-46 - Computational Geography

Computational Geography emerged in the 1980s in response to the reductionist limitations of early GIS software, which inhibited deep analyses of rich geographic data. Today, Computational Geography continues to integrate a wide range of domains to facilitate spatial analyses that require computational resources or ontological paradigms beyond that made available in traditional GIS software packages. These include novel approaches for the mass creation of geospatial data, large-scale database design for the effective storage and querying of spatial identifiers (i.e., distributed spatial databases), and methodologies which enable simulations and/or analysis in the context of large-scale, frequently near-real-time, spatially-explicit sources of information. The topics studied within Computational Geography directly enable many of the world’s largest public databases, including Google Maps and Open Street Map (OSM), as well as many modern analytic pipelines designed to study human behavior with the integration of large volumes of location information (e.g., mobile phone data) with other geospatial sources (e.g., satellite imagery).

GS-27 - GIS&T for Equity and Social Justice

A geographic information system (GIS) can be used effectively for activities, programs, and analyses focused on equity and social justice (ESJ).  Many types of inequities exist in society, but race and space are key predictors of inequity. A key concept of social justice is that any person born into society, no matter where they were born or live, will have an equitable opportunity to achieve successful life outcomes and to thrive. Geographic information science and its technologies (GIS&T) provide powerful tools to analyze equity and social justice issues and help government agencies apply an equity lens to every aspect of their administration. Given the reliance on spatial data to represent and analyze matters of ESJ, the use of these tools is necessary, logical, and appropriate. Some types of analyses and mapping commonly used with ESJ programs require careful attention to how data are combined and represented, risking misleading or false conclusions otherwise. Such outcomes could build mistrust when trust is most needed. A GIS-supported lifecycle for ESJ is presented that includes stages of exploratory issue analysis, community feedback, pro-equity programs analysis, management monitoring and stakeholder awareness, program performance metrics, and effectiveness analysis.

Pages