symbolization

CV-12 - Multivariate Mapping

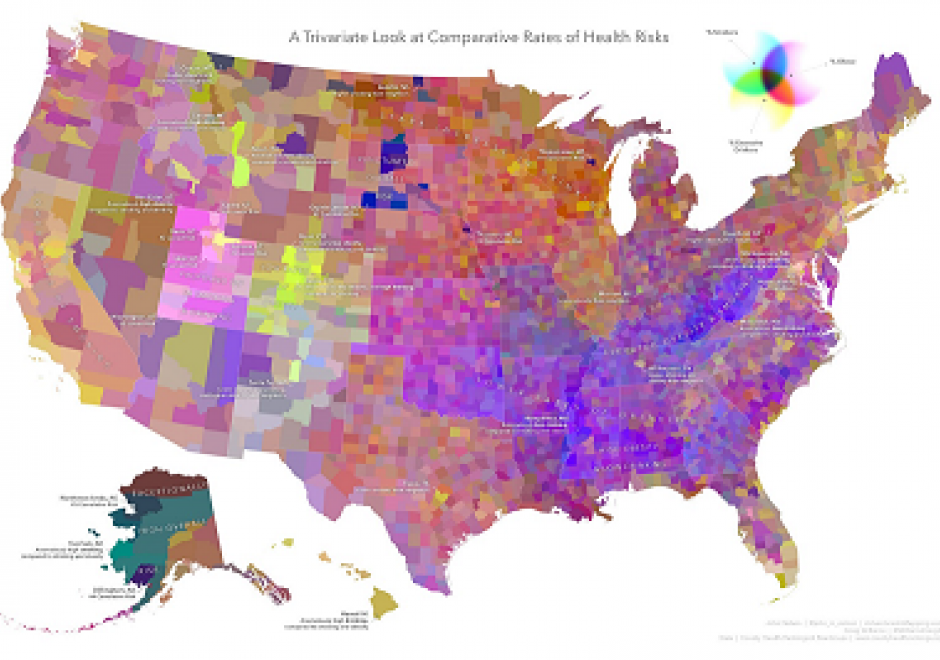
Bivariate and multivariate maps encode two or more data variables concurrently into a single symbolization mechanism. Their purpose is to reveal and communicate relationships between the variables that might not otherwise be apparent via a standard single-variable technique. These maps are inherently more complex, though offer a novel means of visualizing the nuances that may exist between the mapped variables. As information-dense visual products, they can require considerable effort on behalf of the map reader, though a thoughtfully-designed map and legend can be an interesting opportunity to effectively convey a comparative dimension.

This chapter describes some of the key types of bivariate and multivariate maps, walks through some of the rationale for various techniques, and encourages the reader to take an informed, balanced approach to map design weighing information density and visual complexity. Some alternatives to bivariate and multivariate mapping are provided, and their relative merits are discussed.

CV-08 - Symbolization and the Visual Variables
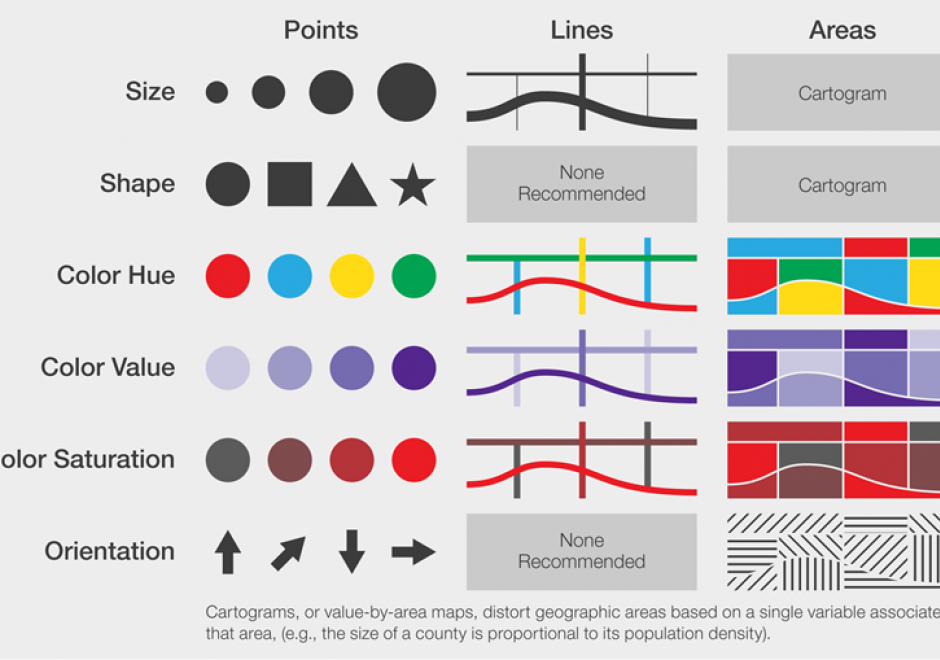
Maps communicate information about the world by using symbols to represent specific ideas or concepts. The relationship between a map symbol and the information that symbol represents must be clear and easily interpreted. The symbol design process requires first an understanding of the underlying nature of the data to be mapped (e.g., its spatial dimensions and level of measurement), then the selection of symbols that suggest those data attributes. Cartographers developed the visual variable system, a graphic vocabulary, to express these relationships on maps. Map readers respond to the visual variable system in predictable ways, enabling mapmakers to design map symbols for most types of information with a high degree of reliability.

Pages