2017 QUARTER 04

A B C D E F G H I K L M N O P R S T U V W
DC-13 - Stereoscopy and orthoimagery
  • Explain the relevance of the concept “parallax” in stereoscopic aerial imagery
  • Evaluate the advantages and disadvantages of photogrammetric methods and LiDAR for production of terrain elevation data
  • Specify the technical components of an aerotriangulation system
  • Outline the sequence of tasks involved in generating an orthoimage from a vertical aerial photograph
FC-12 - Structured Query Language (SQL) and attribute queries
  • Define basic terms of query processing (e.g., SQL, primary and foreign keys, table join)
  • Create an SQL query to retrieve elements from a GIS
  • Explain the basic logic of SQL syntax
  • Demonstrate the basic syntactic structure of SQL
CV-08 - Symbolization and the Visual Variables

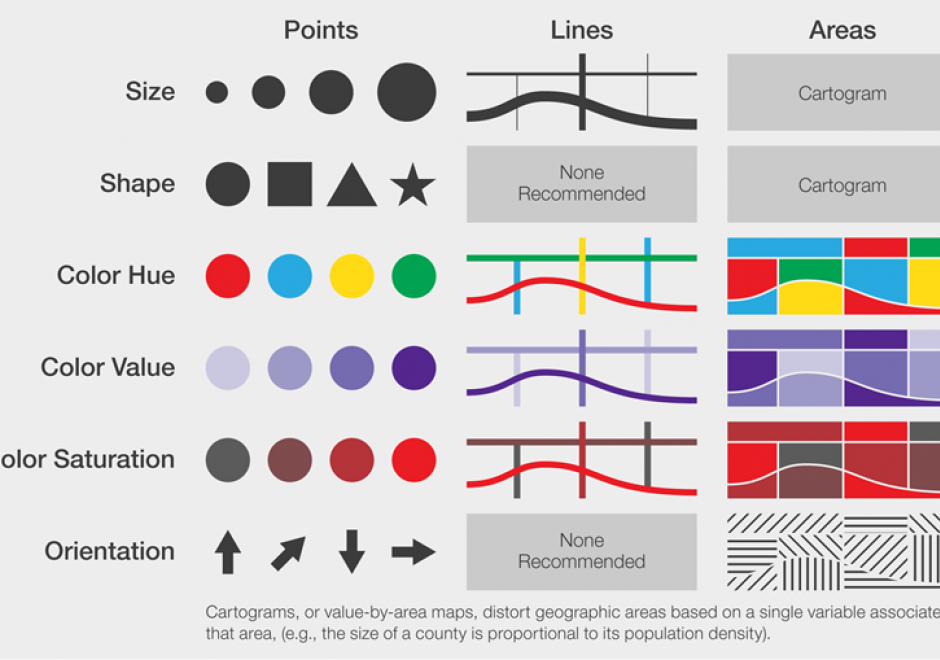
Maps communicate information about the world by using symbols to represent specific ideas or concepts. The relationship between a map symbol and the information that symbol represents must be clear and easily interpreted. The symbol design process requires first an understanding of the underlying nature of the data to be mapped (e.g., its spatial dimensions and level of measurement), then the selection of symbols that suggest those data attributes. Cartographers developed the visual variable system, a graphic vocabulary, to express these relationships on maps. Map readers respond to the visual variable system in predictable ways, enabling mapmakers to design map symbols for most types of information with a high degree of reliability.

PD-07 - System deployment
  • Develop a phasing schedule for deployment of an enterprise-wide system
  • Integrate geospatial applications with other enterprise information systems
KE-21 - System management
  • Demonstrate how the way people do their jobs can affect system management
  • Describe methods for articulating user needs to internal technical support staff
  • Describe how system management includes understanding people
PD-06 - System testing
  • Describe the goals of alpha and beta testing
  • Implement established testing procedures on prototype systems
  • Use testing results to prepare a system for deployment
  • Conduct a quality assurance review
DM-46 - Systematic methods
  • Describe the historical context of the USPLS
  • Discuss the consequences of the USPLS with regard to public administration (i.e., zoning)
  • Explain how townships, ranges, and their sections are delineated in terms of baselines and principal meridians
  • Illustrate how to quarter-off portions of a township and range section
  • Discuss advantages and disadvantages of systematic land partitioning methods in the context of GIS
  • Differentiate the USPLS from the geographic coordinate system
  • Describe the New England Town partitioning system
  • Compare and contrast the United States Public Land Survey System (USPLS) and the Spanish land grant and French long lot systems
CP-05 - Technology transfer
  • Explain how an understanding of use of current and proposed technology in other organizations can aid in implementing a GIS
CV-14 - Terrain Representation

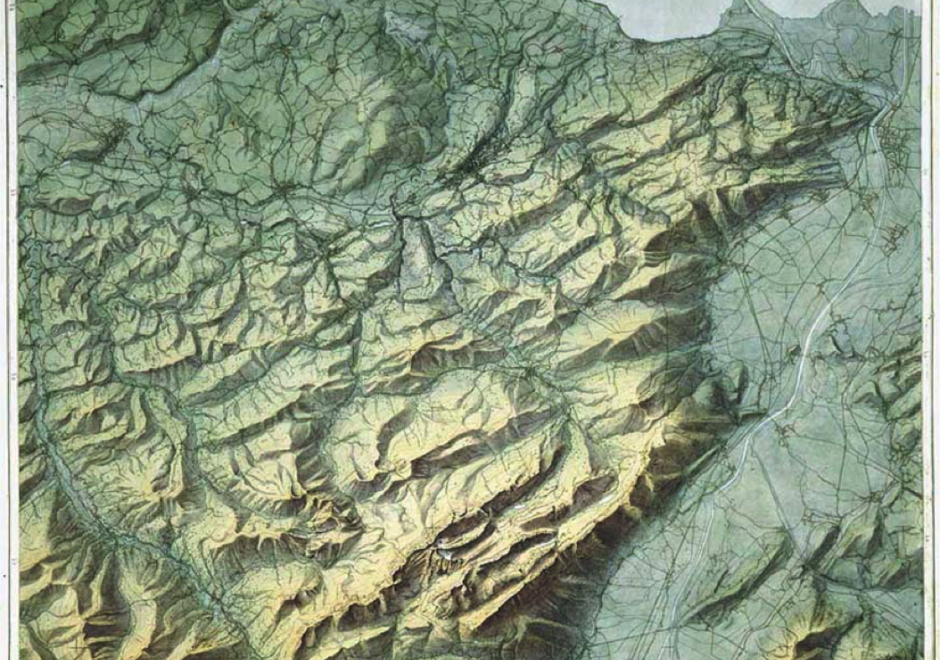
Terrain representation is the manner by which elevation data are visualized. Data are typically stored as 2.5D grid representations, including digital elevation models (DEMs) in raster format and triangulated irregular networks (TINs). These models facilitate terrain representations such as contours, shaded relief, spot heights, and hypsometric tints, as well as automate calculations of surface derivatives such as slope, aspect, and curvature. 3D effects have viewing directions perpendicular (plan), parallel (profile), or panoramic (oblique view) to the elevation’s vertical datum plane. Recent research has focused on automating, stylizing, and enhancing terrain representations. From the user’s perspective, representations of elevation are measurable or provide a 3D visual effect, with much overlap between the two. The ones a user can measure or derive include contours, hypsometric tinting, slope, aspect, and curvature. Other representations focus on 3D effect and may include aesthetic considerations, such as hachures, relief shading, physiographic maps, block diagrams, rock drawings, and scree patterns. Relief shading creates the 3D effect using the surface normal and illumination vectors with the Lambertian assumption. Non-plan profile or panoramic views are often enhanced by vertical exaggeration. Cartographers combine techniques to mimic or create mapping styles, such as the Swiss-style.

DM-49 - Tessellated referencing systems
  • Explain the concept “quadtree”
  • Describe the octahedral quarternary triangulated mesh georeferencing system proposed by Dutton
  • Discuss the advantages of hierarchical coordinates relative to geographic and plane coordinate systems

Pages