2020 QUARTER 03

A B C D E F G H I J K L M N O P R S T U V W
DC-11 - Street-level Imagery

Street-level imagery consists of collections of photographs taken from the perspective of moving pedestrians or vehicles. These collections are often stitched together digitally and georeferenced to create interactive and immersive landscapes that are virtually navigable by users. Such landscapes, sometimes called 360-degree panoramas, or bubbles, are uploaded onto web platforms, and linked with geographical databases, which allows users to search and explore the imagery in various ways. IT companies such as Google have created street-level imagery platforms that rely primarily on paid drivers, although they have begun to rely on contributor submissions to complement and expand their coverage. Recently services such as Mapillary and OpenStreetCam have advanced a model that relies primarily on volunteer contributors, leveraging community interest from projects such as OpenStreetMap. While street-level imagery has become a widespread tool with multiple commercial and non-commercial applications, it is also entangled various legal and public opinion controversies, due to its capabilities for private data collection and surveillance. 

FC-12 - Structured Query Language (SQL) and attribute queries
  • Define basic terms of query processing (e.g., SQL, primary and foreign keys, table join)
  • Create an SQL query to retrieve elements from a GIS
  • Explain the basic logic of SQL syntax
  • Demonstrate the basic syntactic structure of SQL
CV-08 - Symbolization and the Visual Variables

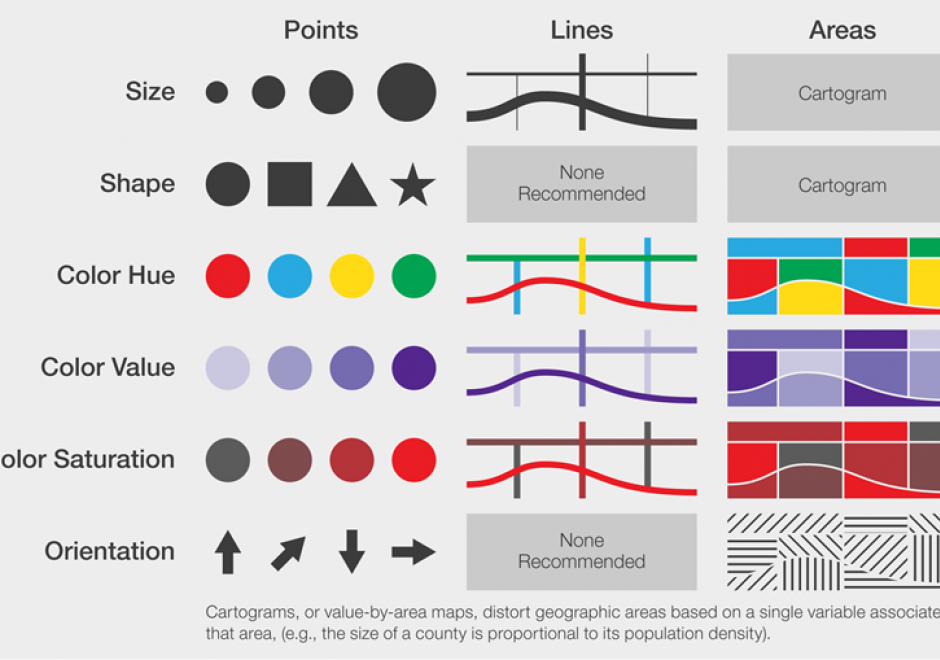
Maps communicate information about the world by using symbols to represent specific ideas or concepts. The relationship between a map symbol and the information that symbol represents must be clear and easily interpreted. The symbol design process requires first an understanding of the underlying nature of the data to be mapped (e.g., its spatial dimensions and level of measurement), then the selection of symbols that suggest those data attributes. Cartographers developed the visual variable system, a graphic vocabulary, to express these relationships on maps. Map readers respond to the visual variable system in predictable ways, enabling mapmakers to design map symbols for most types of information with a high degree of reliability.

KE-21 - System Modelling for Effective GIS Management

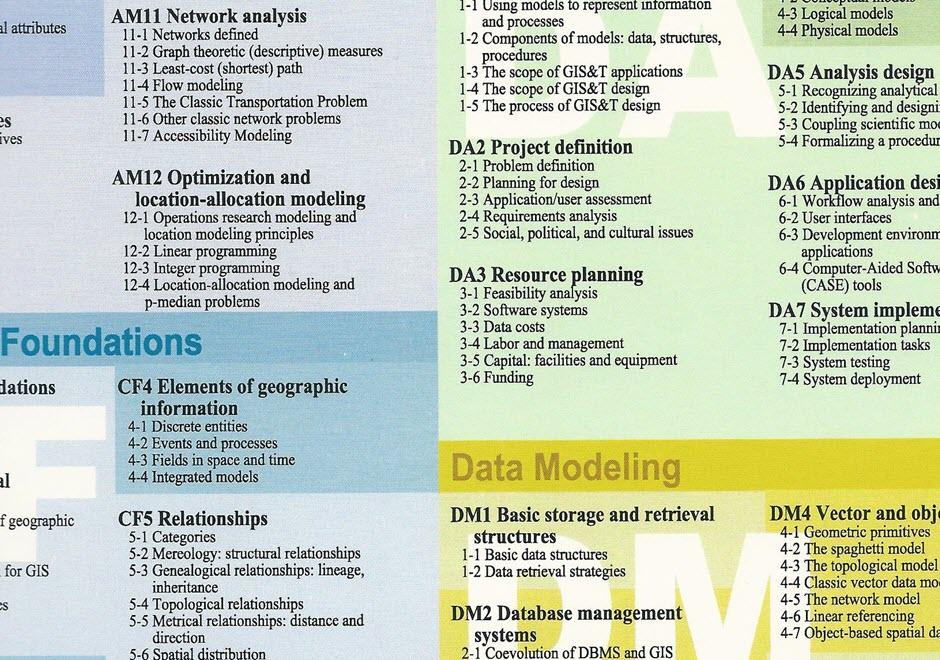
A geographic information system in operation is highly complex, as the scope of the GIS&T Body of Knowledge demonstrates. Modern society relies on many complex systems, but most are self-contained mechanisms with limited and well defined interfaces. A GIS is a complex open system that extends across the realms of hardware, software, data, science, and human processes. A conceptual model of a GIS can be an effective tool to design, implement, operate, maintain, manage, and assessment tool.

CV-14 - Terrain Representation

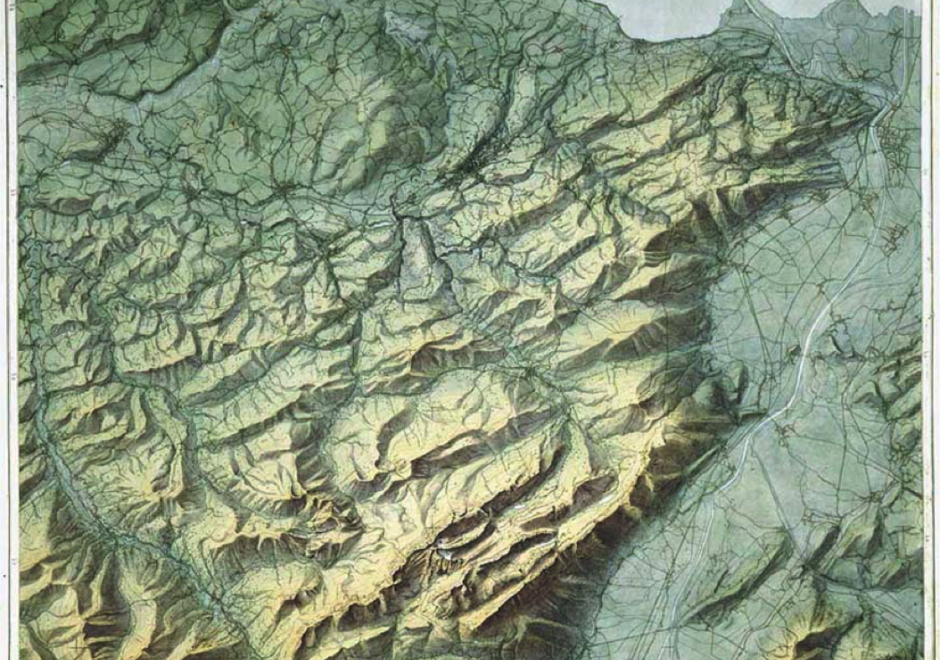
Terrain representation is the manner by which elevation data are visualized. Data are typically stored as 2.5D grid representations, including digital elevation models (DEMs) in raster format and triangulated irregular networks (TINs). These models facilitate terrain representations such as contours, shaded relief, spot heights, and hypsometric tints, as well as automate calculations of surface derivatives such as slope, aspect, and curvature. 3D effects have viewing directions perpendicular (plan), parallel (profile), or panoramic (oblique view) to the elevation’s vertical datum plane. Recent research has focused on automating, stylizing, and enhancing terrain representations. From the user’s perspective, representations of elevation are measurable or provide a 3D visual effect, with much overlap between the two. The ones a user can measure or derive include contours, hypsometric tinting, slope, aspect, and curvature. Other representations focus on 3D effect and may include aesthetic considerations, such as hachures, relief shading, physiographic maps, block diagrams, rock drawings, and scree patterns. Relief shading creates the 3D effect using the surface normal and illumination vectors with the Lambertian assumption. Non-plan profile or panoramic views are often enhanced by vertical exaggeration. Cartographers combine techniques to mimic or create mapping styles, such as the Swiss-style.

DM-49 - Tessellated referencing systems
  • Explain the concept “quadtree”
  • Describe the octahedral quarternary triangulated mesh georeferencing system proposed by Dutton
  • Discuss the advantages of hierarchical coordinates relative to geographic and plane coordinate systems
KE-29 - The geospatial community
  • Describe possible benefits to an organization by participating in a given society that is related to GIS&T
  • Discuss the value or effect of participation in societies, conferences, and informal communities to entities managing enterprise GIS
  • Identify conferences that are related to GIS&T
KE-30 - The geospatial industry
  • Assess the involvement of non-GIS companies (e.g., Microsoft, Google) in the geospatial industry
  • Describe three applications of geospatial technology for different workforce domains (e.g., first responders, forestry, water resource management, facilities management)
  • Explain why software products sold by U.S. companies may predominate in foreign markets, including Europe and Australia
  • Describe the U.S. geospatial industry including vendors, software, hardware and data
DM-09 - The hexagonal model
  • Illustrate the hexagonal model
  • Explain the limitations of the grid model compared to the hexagonal model
  • Exemplify the uses (past and potential) of the hexagonal model
GS-01 - The legal regime
  • Discuss ways in which the geospatial profession is regulated under the U.S. legal regime
  • Compare and contrast the relationship of the geospatial profession and the U.S. legal regime with similar relationships in other countries

Pages