Search Page

Showing 11 - 20 of 34
AM-107 - Spatial Data Uncertainty

Although spatial data users may not be aware of the inherent uncertainty in all the datasets they use, it is critical to evaluate data quality in order to understand the validity and limitations of any conclusions based on spatial data. Spatial data uncertainty is inevitable as all representations of the real world are imperfect. This topic presents the importance of understanding spatial data uncertainty and discusses major methods and models to communicate, represent, and quantify positional and attribute uncertainty in spatial data, including both analytical and simulation approaches. Geo-semantic uncertainty that involves vague geographic concepts and classes is also addressed from the perspectives of fuzzy-set approaches and cognitive experiments. Potential methods that can be implemented to assess the quality of large volumes of crowd-sourced geographic data are also discussed. Finally, this topic ends with future directions to further research on spatial data quality and uncertainty.

CV-03 - Vector Formats and Sources
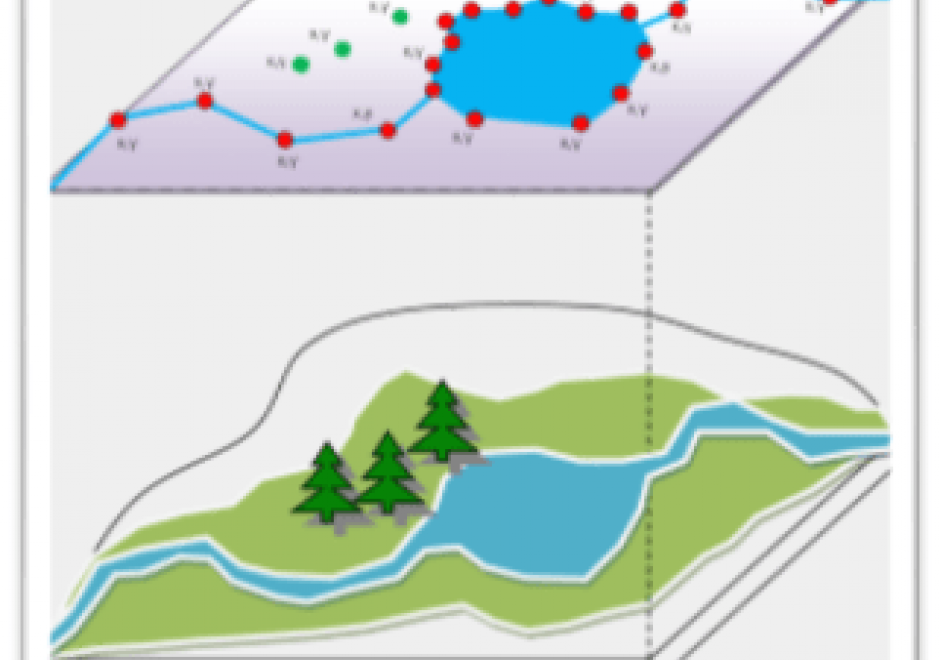
In the last ten years, the rise of efficient computing devices with significant processing power and storage has caused a surge in digital data collection and publication. As more software programs and hardware devices are released, we are not only seeing an increase in available data, but also an increase in available data formats. Cartographers today have access to a wide range of interesting datasets, and online portals for downloading geospatial data now frequently offer that data in several different formats. This chapter provides information useful to modern cartographers working with vector data, including an overview of common vector data formats (e.g. shapefile, GeoJSON, file geodatabase); their relative benefits, idiosyncrasies, and limitations; and a list of popular sources for geospatial vector data (e.g. United States Census Bureau, university data warehouses).

CP-04 - Artificial Intelligence Tools and Platforms for GIS

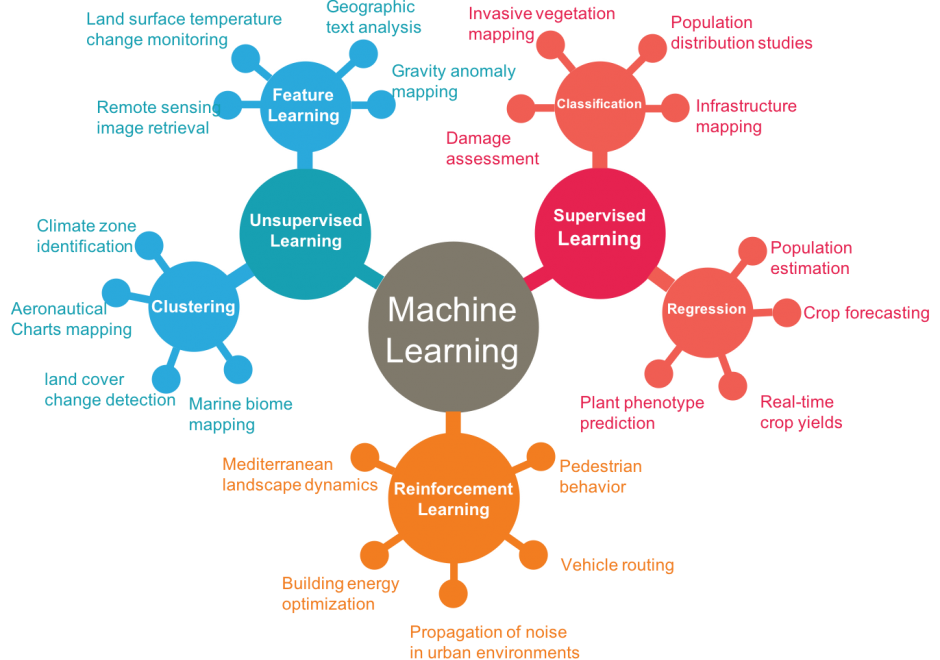
Artificial intelligence is the study of intelligence agents as demonstrated by machines. It is an interdisciplinary field involving computer science as well as, various kinds of engineering and science, for example, robotics, bio-medical engineering, that accentuates automation of human acts and intelligence through machines. AI represents state-of-the-art use of machines to bring about algorithmic computation and understanding of tasks that include learning, problem solving, mapping, perception, and reasoning. Given the data and a description of its properties and relations between objects of interest, AI methods can perform the aforementioned tasks. Widely applied AI capabilities, e.g. learning, are now achievable at large scale through machine learning (ML), large volumes of data and specialized computational machines. ML encompasses learning without any kind of supervision (unsupervised learning) and learning with full supervision (supervised learning). Widely applied supervised learning techniques include deep learning and other machine learning methods that require less data than deep learning e.g. support vector machines, random forests. Unsupervised learning examples include dictionary learning, independent component analysis, and autoencoders. For application tasks with less labeled data, both supervised and unsupervised techniques can be adapted in a semi-supervised manner to produce accurate models and to increase the size of the labeled training data.

DM-90 - Hydrographic Geospatial Data Standards

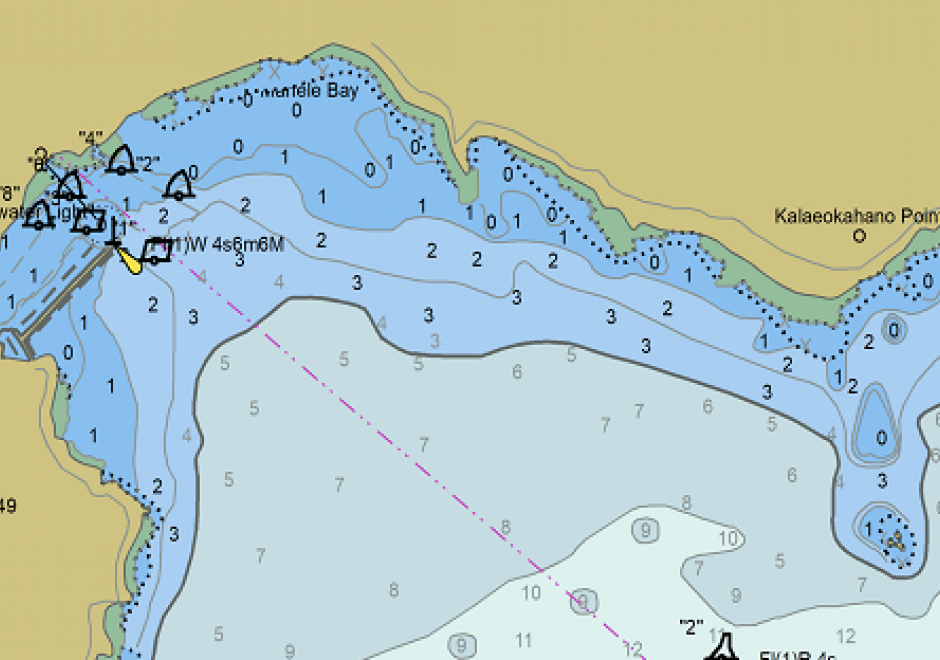
Coastal nations, through their dedicated Hydrographic Offices (HOs), have the obligation to provide nautical charts for the waters of national jurisdiction in support of safe maritime navigation. Accurate and reliable charts are essential to seafarers whether for commerce, defense, fishing, or recreation. Since navigation can be an international activity, mariners often use charts published from different national HOs. Standardization of data collection and processing, chart feature generalization methods, text, symbology, and output validation becomes essential in providing mariners with consistent and uniform products regardless of the region or the producing nation. Besides navigation, nautical charts contain information about the seabed and the coastal environment useful in other domains such as dredging, oceanography, geology, coastal modelling, defense, and coastal zone management. The standardization of hydrographic and nautical charting activities is achieved through various publications issued by the International Hydrographic Organization (IHO). This chapter discusses the purpose and importance of nautical charts, the establishment and role of the IHO in coordinating HOs globally, the existing hydrographic geospatial data standards, as well as those under development based on the new S-100 Universal Hydrographic Data Model.

DM-20 - Entity-based Models

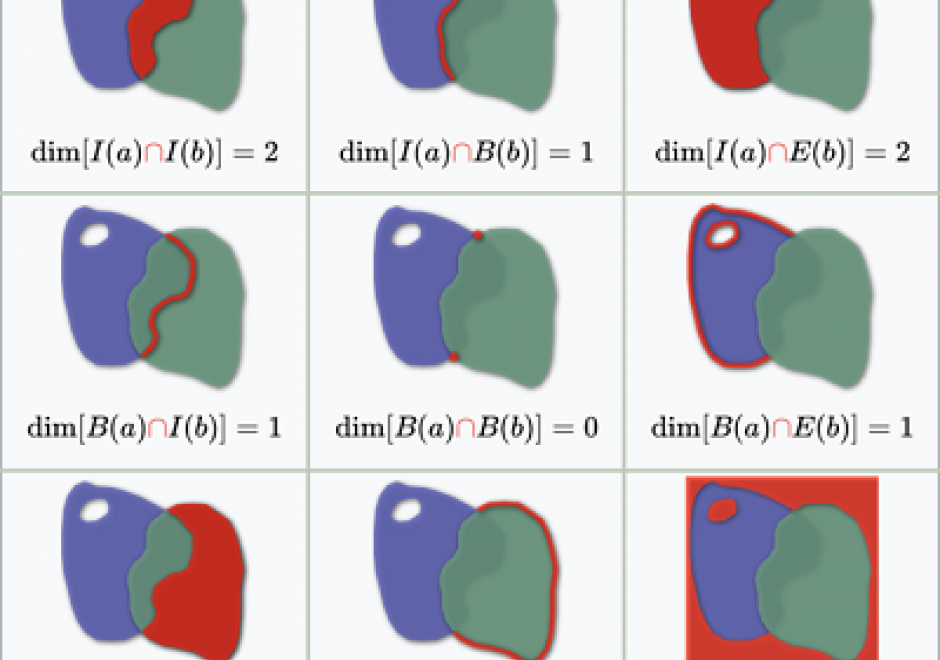
As we translate real world phenomena into data structures that we can store in a computer, we must determine the most appropriate spatial representation and how it relates to the characteristics of such a phenomenon. All spatial representations are derivatives of graph theory and should therefore be described in such terms. This then helps to understand the principles of low-level GIS operations. A constraint-driven approach allows the reader to evaluate implementations of the geo-relational principle in terms of the hierarchical level of mathematical space adopted.

CV-30 - Map Production and Management

Map production describes the experience of managing the many aspects and details of map creation. Often the map product is created for someone else—a client, supervisor, or instructor. Describing the intention of the map and evaluating available resources ahead of the project can help the cartographer define content requirements, stay on task, and ultimately meet deadlines. The project management life cycle involves clear communication between the cartographer and client, with resolutions to common questions best addressed at the beginning of the project. The process then iteratively cycles through phases that include research and production, followed by quality control, and concludes with file preparation and delivery.

CV-34 - Map Icon Design

The use of map icons is an efficient way to condense a map object into a concise expression of geospatial data. Like all cartographic design, map icon design merges artistic and scientific elements into symbolic representations intended to be readily legible to map readers. This entry reviews the types of map icons and elements of icon design, including the ways in which the visual variables are used in map icon communication. As communicative devices, icons are imbued with cultural meanings and can oftentimes lead to the preservation of stereotypes. This review concludes with an examination of icons’ perpetuation of – and challenge to – cultural stereotypes.

AM-10 - Spatial Interaction

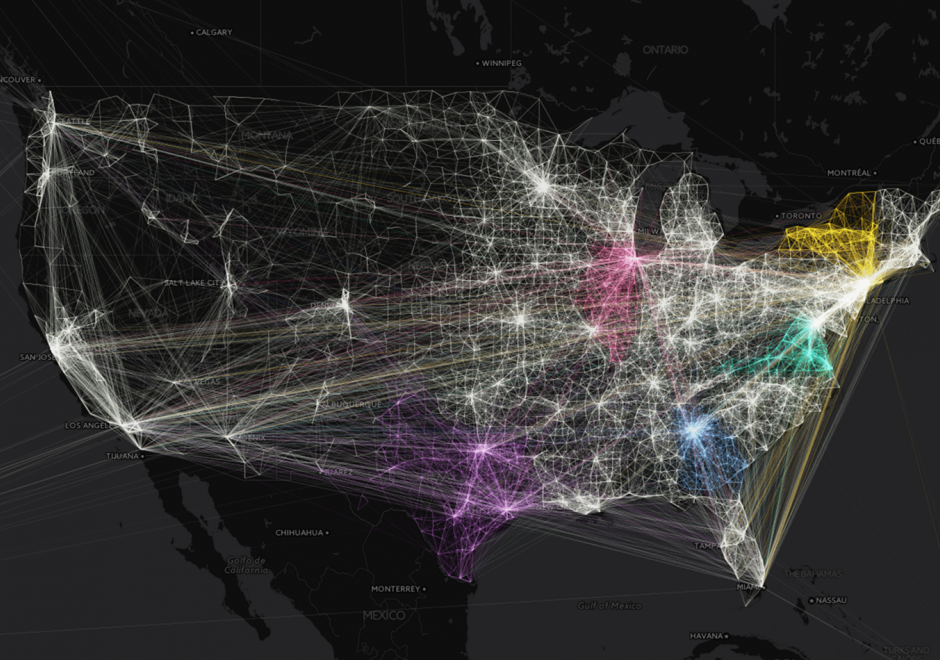
Spatial interaction (SI) is a fundamental concept in the GIScience literature, and may be defined in numerous ways. SI often describes the "flow" of individuals, commodities, capital, and information over (geographic) space resulting from a decision process. Alternatively, SI is sometimes used to refer to the influence of spatial proximity of places on the intensity of relations between those places. SI modeling as a separate research endeavor developed out of a need to mathematically model and understand the underlying determinants of these flows/influences. Proponents of SI modeling include economic geographers, regional scientists, and regional planners, as well as climate scientists, physicists, animal ecologists, and even some biophysical/environmental researchers. Originally developed from theories of interacting particles and gravitational forces in physics, SI modeling has developed through a series of refinements in terms of functional form, conceptual representations of distances, as well as a range of analytically rigorous technical improvements.
 

CV-13 - User Interface and User Experience (UI/UX) Design

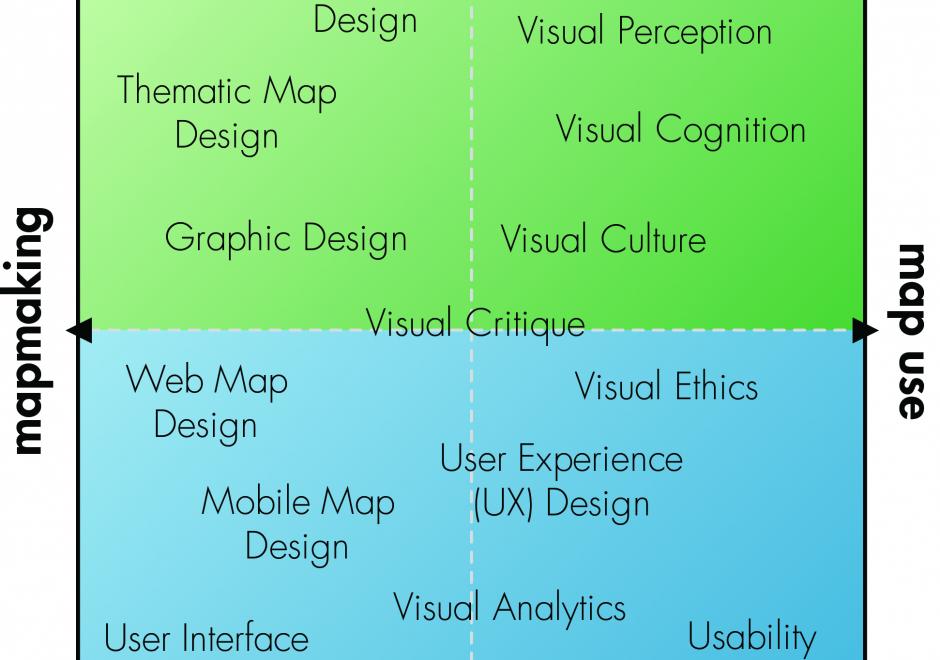
Advances in personal computing and information technologies have fundamentally transformed how maps are produced and consumed, as many maps today are highly interactive and delivered online or through mobile devices. Accordingly, we need to consider interaction as a fundamental complement to representation in cartography and visualization. UI (user interface) / UX (user experience) describes a set of concepts, guidelines, and workflows for critically thinking about the design and use of an interactive product, map or otherwise. This entry introduces core concepts from UI/UX design important to cartography and visualization, focusing on issues related to visual design. First, a fundamental distinction is made between the use of an interface as a tool and the broader experience of an interaction, a distinction that separates UI design and UX design. Norman’s stages of interaction framework then is summarized as a guiding model for understanding the user experience with interactive maps, noting how different UX design solutions can be applied to breakdowns at different stages of the interaction. Finally, three dimensions of UI design are described: the fundamental interaction operators that form the basic building blocks of an interface, interface styles that implement these operator primitives, and recommendations for visual design of an interface.

GS-15 - Feminist Critiques of GIS

Feminist interactions with GIS started in the 1990s in the form of strong critiques against GIS inspired by feminist and postpositivist theories. Those critiques mainly highlighted a supposed epistemological dissonance between GIS and feminist scholarship. GIS was accused of being shaped by positivist and masculinist epistemologies, especially due to its emphasis on vision as the principal way of knowing. In addition, feminist critiques claimed that GIS was largely incompatible with positionality and reflexivity, two core concepts of feminist theory. Feminist critiques of GIS also discussed power issues embedded in GIS practices, including the predominance of men in the early days of the GIS industry and the development of GIS practices for the military and surveillance purposes.

At the beginning of the 21st century, feminist geographers reexamined those critiques and argued against an inherent epistemological incompatibility between GIS methods and feminist scholarship. They advocated for a reappropriation of GIS by feminist scholars in the form of critical feminist GIS practices. The critical GIS perspective promotes an unorthodox, reconstructed, and emancipatory set of GIS practices by critiquing dominant approaches of knowledge production, implementing GIS in critically informed progressive social research, and developing postpositivist techniques of GIS. Inspired by those debates, feminist scholars did reclaim GIS and effectively developed feminist GIS practices.

Pages