2020 QUARTER 01

A B C D E F G H I K L M N O P R S T U V W
FC-29 - Public sector origins
  • Identify some of the key federal agencies and programs that provided the impetus for the development of GIS&T
  • Explain how the federalization of land management in Canada led to the development of the Canadian Geographic Information System in the 1960s
  • Discuss the role of the U.S. Census Bureau in contributing to the development of the U.S. geospatial industry
  • Discuss the role of the U.S. Geological Survey in contributing to the development of the U.S. geospatial industry
  • Describe the mechanical and computerized technologies used by civilian and military mapping agencies between World War II and the advent of GIS
  • Trace the history of the relationship between the intelligence community and the geospatial industry
  • Compare and contrast the initiatives of various countries to move their national mapping activities to geospatial data
  • Describe the role of NASA and the Landsat program in promoting development of digital image processing and raster GIS systems
KE-28 - Publications
  • Describe the leading academic journals serving the GIS&T community
  • Select association and for-profit journals that are useful to entities managing enterprise GISs
  • Select and describe the leading trade journals serving the GIS&T community
  • Develop a bibliography of scholarly and professional articles and/or books that are relevant to a particular GIS&T project
PD-11 - Python for GIS

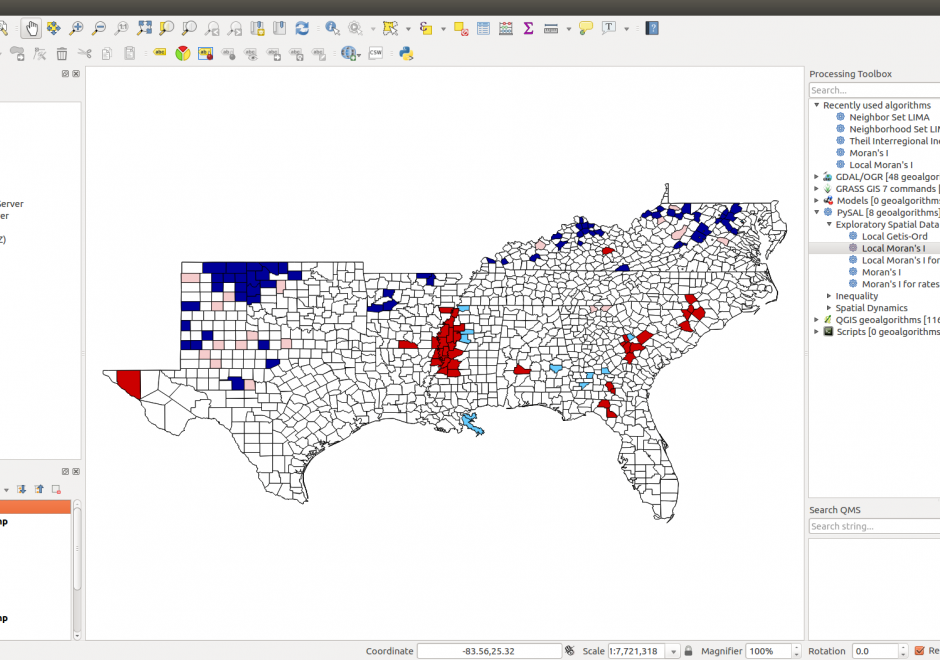
Figure 1. PySAL within QGIS Processing Toolbox: Hot-spot analysis of Homicide Rates in Southern US Counties.


Python is a popular language for geospatial programming and application development. This entry provides an overview of the different development modes that can be adopted for GIS programming with Python and discusses the history of Python adoption in the GIS community. The different layers of the geospatial development stack in Python are examined giving the reader an understanding of the breadth that Python offers to the GIS developer. Future developments and broader issues related to interoperability and programming ecosystems are identified.

PD-15 - R for Geospatial Analysis and Mapping

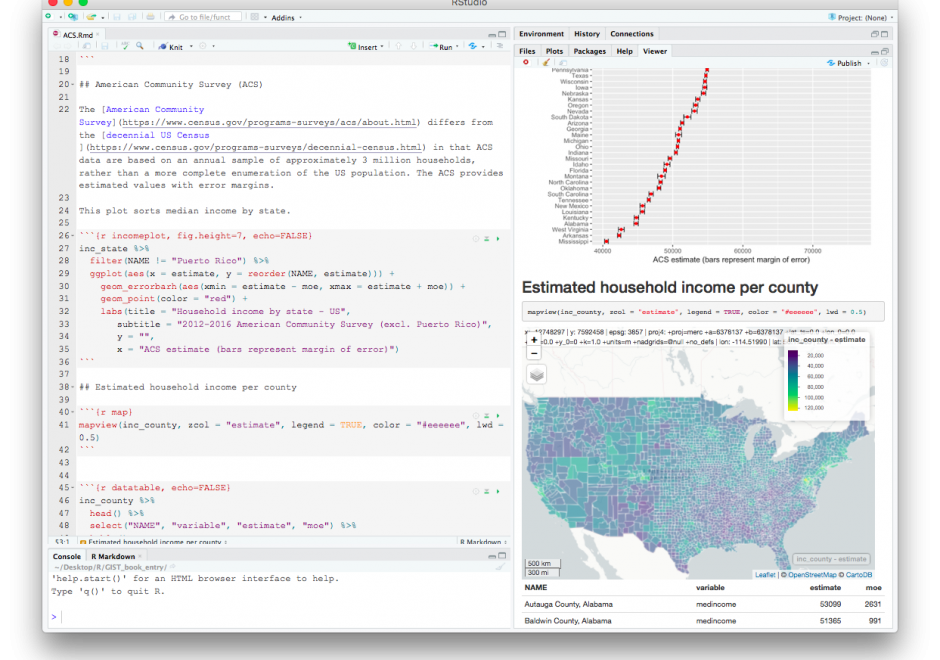
R is a programming language as well as a computing environment to perform a wide variety of data analysis, statistics, and visualization. One of the reasons for the popularity of R is that it embraces open, transparent scholarship and reproducible research. It is possible to combine content and code in one document, so data, analysis, and graphs are tied together into one narrative, which can be shared with others to recreate analyses and reevaluate interpretations. Different from tools like ArcGIS or QGIS that are specifically built for spatial data, GIS functionality is just one of many things R offers. And while users of dedicated GIS tools typically interact with the software via a point-and-click graphical interface, R requires command-line scripting. Many R users today rely on RStudio, an integrated development environment (IDE) that facilitates the writing of R code and comes with a series of convenient features, like integrated help, data viewer, code completion, and syntax coloring. By using R Markdown, a particular flavor of the Markdown language, RStudio also makes it particularly easy to create documents that embed and execute R code snippets within a text and to render both, static documents (like PDF), as well as interactive html pages, a feature particularly useful for exploratory GIS work and mapping.

CV-20 - Raster Formats and Sources

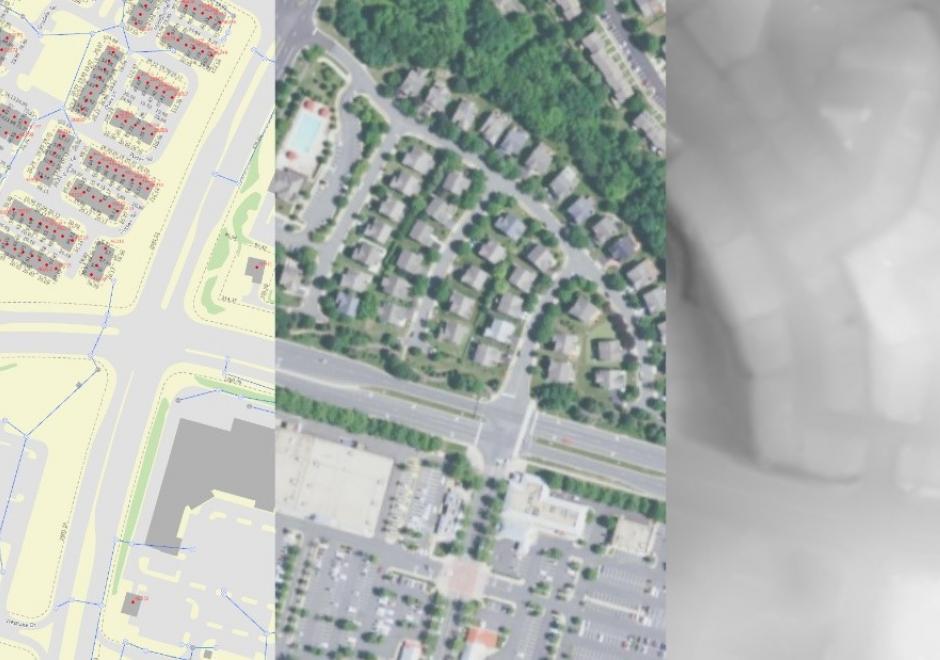
Raster data is commonly used by cartographers in concert with vector data. Choice of raster file format is important when using raster data or producing raster output from vector data. Raster formats are designed for specific purposes and have limitations in color representation and data loss. The simplest raster formats are just a single two-dimensional array of pixels, where multi-band raster datasets use additional data values to represent color or other data. The article covers considerations for the intended use of raster formats. Formats and resolutions appropriate for the web may not be appropriate for print or higher resolution devices. Several types of raster sources are available including single band measures, imagery, and existing raster maps or basemaps. The future of raster will evolve as more formats, sources, and computational improvements are made.

AM-60 - Raster resampling
  • Evaluate methods used by contemporary GIS software to resample raster data on-the-fly during display
  • Select appropriate interpolation techniques to resample particular types of values in raster data (e.g., nominal using nearest neighbor)
  • Resample multiple raster data sets to a single resolution to enable overlay
  • Resample raster data sets (e.g., terrain, satellite imagery) to a resolution appropriate for a map of a particular scale
  • Discuss the consequences of increasing and decreasing resolution
DM-03 - Relational DBMS
  • Explain the advantage of the relational model over earlier database structures including spreadsheets
  • Define the basic terms used in relational database management systems (e.g., tuple, relation, foreign key, SQL, relational join)
  • Discuss the efficiency and costs of normalization
  • Describe the entity-relationship diagram approach to data modeling
  • Explain how entity-relationship diagrams are translated into relational tables
  • Create an SQL query that extracts data from related tables
  • Describe the problems associated with failure to follow the first and second normal forms (including data confusion, redundancy, and retrieval difficulties)
  • Demonstrate how search and relational join operations provide results for a typical GIS query and other simple operations using the relational DBMS within a GIS software application
FC-09 - Relationships between space and time
  • Discuss common prepositions and adjectives (in any particular language) that signify either spatial or temporal relations but are used for both kinds, such as “after” or “longer”
  • Describe different types of movement and change
  • Understand the physical notions of velocity and acceleration which are fundamentally about movement across space through time
  • Identify various types of geographic interactions in space and time
  • Compare and contrast the characteristics of spatial and temporal dimensions
DC-26 - Remote Sensing Platforms

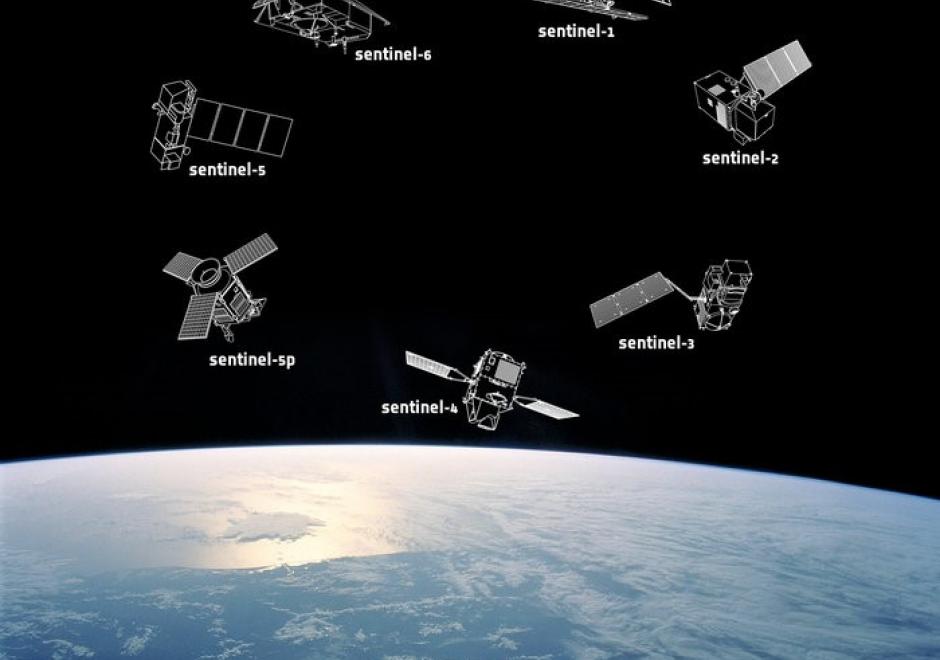
Remote sensing means acquiring and measuring information about an object or phenomenon via a device that is not in physical or direct contact with what is being studied (Colwell, 1983).To collect remotely sensed data, a platform – an instrument that carries a remote sensing sensor – is deployed. From the mid 1800’s to the early 1900’s, various platforms such as balloons, kites, and pigeons carried mounted cameras to collect visual data of the world below. Today, aircraft (both manned and unmanned) and satellites collect the majority of remotely sensed data. The sensors typically deployed on these platforms include film and digital cameras, light-detection and ranging (LiDAR) systems, synthetic aperture radar (SAR) systems, and multi-spectral and hyper-spectral scanners. Many of these instruments can be mounted on land-based platforms, such as vans, trucks, tractors, and tanks. In this chapter, we will explore the different types of platforms and their resulting remote sensing applications.

CV-18 - Representing Uncertainty

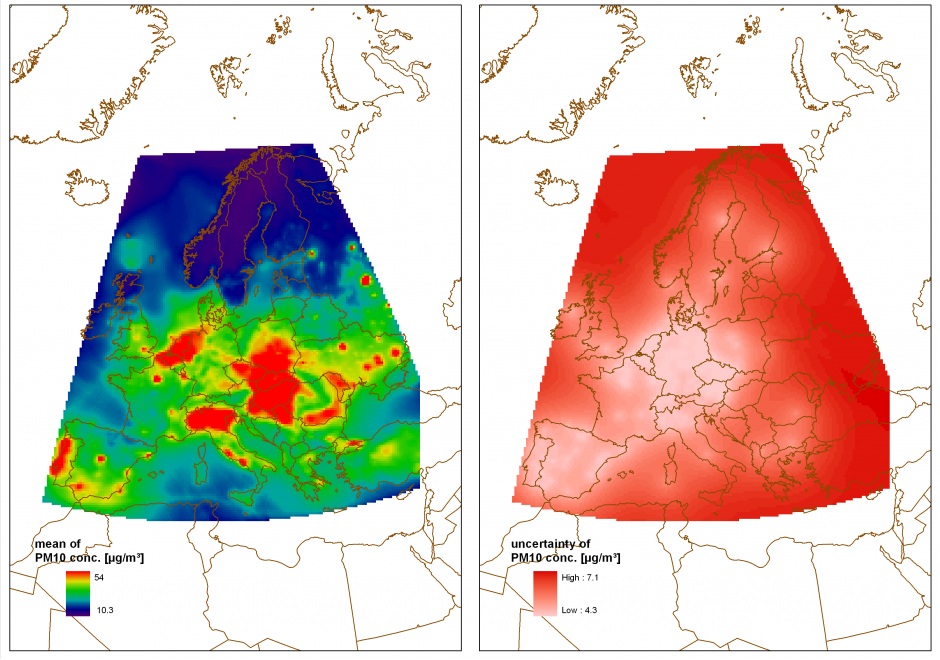
Using geospatial data involves numerous uncertainties stemming from various sources such as inaccurate or erroneous measurements, inherent ambiguity of the described phenomena, or subjectivity of human interpretation. If the uncertain nature of the data is not represented, ill-informed interpretations and decisions can be the consequence. Accordingly, there has been significant research activity describing and visualizing uncertainty in data rather than ignoring it. Multiple typologies have been proposed to identify and quantify relevant types of uncertainty and a multitude of techniques to visualize uncertainty have been developed. However, the use of such techniques in practice is still rare because standardized methods and guidelines are few and largely untested. This contribution provides an introduction to the conceptualization and representation of uncertainty in geospatial data, focusing on strategies for the selection of suitable representation and visualization techniques.

Pages