2022 QUARTER 03

A B C D E F G H I J K L M N O P R S T U V W
DM-36 - Physical Data Models

Constructs within a particular implementation of database management software guide the development of a physical data model, which is a product of a physical database design process. A physical data model documents how data are to be stored and accessed on storage media of computer hardware.  A physical data model is dependent on specific data types and indexing mechanisms used within database management system software.  Data types such as integers, reals, character strings, plus many others can lead to different storage structures. Indexing mechanisms such as region-trees and hash functions and others lead to differences in access performance.  Physical data modeling choices about data types and indexing mechanisms related to storage structures refine details of a physical database design. Data types associated with field, record and file storage structures together with the access mechanisms to those structures foster (constrain) performance of a database design. Since all software runs using an operating system, field, record, and file storage structures must be translated into operating system constructs to be implemented.  As such, all storage structures are contingent on the operating system and particular hardware that host data management software. 

FC-06 - Place and landscape
  • Explain how the concept of place encompasses more than just location
  • Evaluate the differences in how various parties think or feel differently about a place being modeled
  • Describe the elements of a sense of place or landscape that are difficult or impossible to adequately represent in GIS
  • Differentiate between space and place
  • Differentiate among elements of the meaning of a place that can or cannot be easily represented using geospatial technologies
  • Select a place or landscape with personal meaning and discuss its importance
  • Define the notions of cultural landscape and physical landscape
DM-48 - Plane coordinate systems
  • Explain why plane coordinates are sometimes preferable to geographic coordinates
  • Identify the map projection(s) upon which UTM coordinate systems are based, and explain the relationship between the projection(s) and the coordinate system grid
  • Discuss the magnitude and cause of error associated with UTM coordinates
  • Differentiate the characteristics and uses of the UTM coordinate system from the Military Grid Reference System (MGRS) and the World Geographic Reference System (GEOREF)
  • Explain what State Plane Coordinates system (SPC) eastings and northings represent
  • Associate SPC coordinates and zone specifications with corresponding positions on a U.S. map or globe
  • Identify the map projection(s) upon which SPC coordinate systems are based, and explain the relationship between the projection(s) and the coordinate system grids
  • Discuss the magnitude and cause of error associated with SPC coordinates
  • Recommend the most appropriate plane coordinate system for applications at different spatial extents and justify the recommendation
  • Critique the U.S. Geological Survey’s choice of UTM as the standard coordinate system for the U.S. National Map
  • Describe the characteristics of the “national grids” of countries other than the U.S.
  • Explain what Universal Transverse Mercator (UTM) eastings and northings represent
  • Associate UTM coordinates and zone specifications with corresponding position on a world map or globe
AM-07 - Point Pattern Analysis

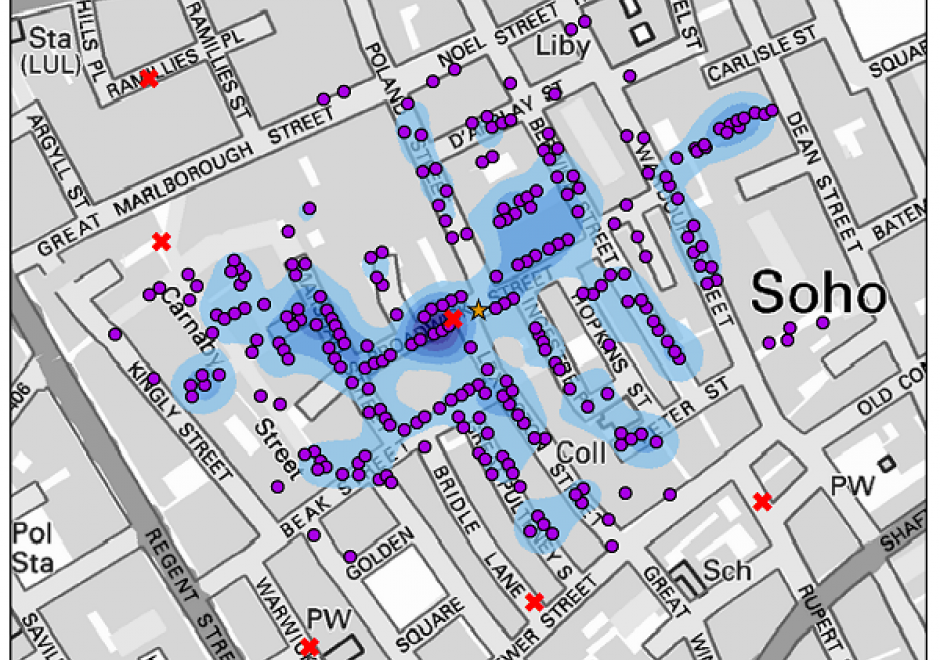
Point pattern analysis (PPA) focuses on the analysis, modeling, visualization, and interpretation of point data. With the increasing availability of big geo-data, such as mobile phone records and social media check-ins, more and more individual-level point data are generated daily. PPA provides an effective approach to analyzing the distribution of such data. This entry provides an overview of commonly used methods in PPA, as well as demonstrates the utility of these methods for scientific investigation based on a classic case study: the 1854 cholera outbreaks in London.

DM-85 - Point, Line, and Area Generalization

Generalization is an important and unavoidable part of making maps because geographic features cannot be represented on a map without undergoing transformation. Maps abstract and portray features using vector (i.e. points, lines and polygons) and raster (i.e pixels) spatial primitives which are usually labeled. These spatial primitives are subjected to further generalization when map scale is changed. Generalization is a contradictory process. On one hand, it alters the look and feel of a map to improve overall user experience especially regarding map reading and interpretive analysis. On the other hand, generalization has documented quality implications and can sacrifice feature detail, dimensions, positions or topological relationships. A variety of techniques are used in generalization and these include selection, simplification, displacement, exaggeration and classification. The techniques are automated through computer algorithms such as Douglas-Peucker and Visvalingam-Whyatt in order to enhance their operational efficiency and create consistent generalization results. As maps are now created easily and quickly, and used widely by both experts and non-experts owing to major advances in IT, it is increasingly important for virtually everyone to appreciate the circumstances, techniques and outcomes of generalizing maps. This is critical to promoting better map design and production as well as socially appropriate uses.

GS-19 - Political influences
  • Recognize the constraints that political forces place on geospatial applications in public and private sectors
  • Evaluate the influences of political ideologies (e.g., Marxism, Capitalism, conservative/liberal) on the understanding of geographic information
  • Evaluate the influences of political actions, especially the allocation of territory, on human perceptions of space and place
AM-27 - Principles of semi-variogram construction
  • Identify and define the parameters of a semi-variogram (range, sill, nugget)
  • Demonstrate how semi-variograms react to spatial nonstationarity
  • Construct a semi-variogram and illustrate with a semi-variogram cloud
  • Describe the relationships between semi-variograms and correlograms, and Moran’s indices of spatial association
AM-87 - Problems of currency, source, and scale
  • Describe the problem of conflation associated with aggregation of data collected at different times, from different sources, and to different scales and accuracy requirements
  • Explain how geostatistical techniques might be used to address such problems
DM-70 - Problems of Large Spatial Databases

Large spatial databases often labeled as geospatial big data exceed the capacity of commonly used computing systems as a result of data volume, variety, velocity, and veracity. Additional problems also labeled with V’s are cited, but the four primary ones are the most problematic and focus of this chapter (Li et al., 2016, Panimalar et al., 2017).  Sources include satellites, aircraft and drone platforms, vehicles, geosocial networking services, mobile devices, and cameras. The problems in processing these data to extract useful information include query, analysis, and visualization. Data mining techniques and machine learning algorithms, such as deep convolutional neural networks, often are used with geospatial big data. The obvious problem is handling the large data volumes, particularly for input and output operations, requiring parallel read and write of the data, as well as high speed computers, disk services, and network transfer speeds. Additional problems of large spatial databases include the variety and heterogeneity of data requiring advanced algorithms to handle different data types and characteristics, and integration with other data. The velocity at which the data are acquired is a challenge, especially using today’s advanced sensors and the Internet of Things that includes millions of devices creating data on short temporal scales of micro seconds to minutes. Finally, the veracity, or truthfulness of large spatial databases is difficult to establish and validate, particularly for all data elements in the database.

FC-26 - Problems of Scale and Zoning

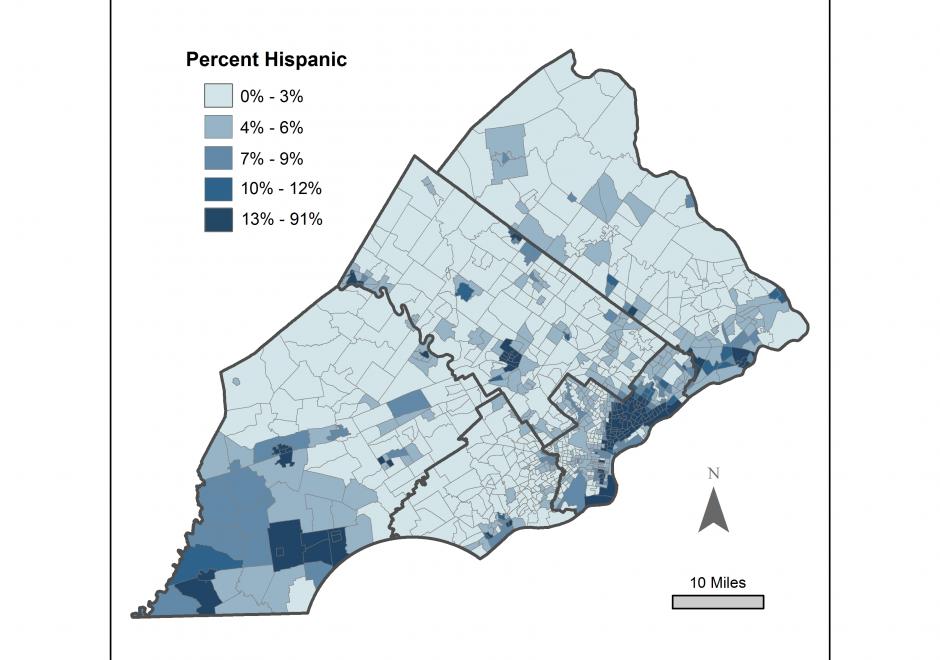
Spatial data are often encoded within a set of spatial units that exhaustively partition a region, where individual level data are aggregated, or continuous data are summarized, over a set of spatial units. Such is the case with census data aggregated to enumeration units for public dissemination. Partitioning schemes can vary by scale, where one partitioning scheme spatially nests within another, or by zoning, where two partitioning schemes have the same number of units but the unit shapes and boundaries differ. The Modifiable Areal Unit Problem (MAUP) refers to the fact the nature of spatial partitioning can affect the interpretation and results of visualization and statistical analysis. Generally, coarser scales of data aggregation tend to have stronger observed statistical associations among variables. The ecological fallacy refers to the assumption that an individual has the same attributes as the aggregate group to which it belongs. Combining spatial data with different partitioning schemes to facilitate analysis is often problematic. Areal interpolation may be used to estimate data over small areas or ecological inference may be used to infer individual behaviors from aggregate data. Researchers may also perform analyses at multiple scales as a point of comparison.

Pages