Search Page

Showing 21 - 27 of 27
AM-106 - Error-based Uncertainty

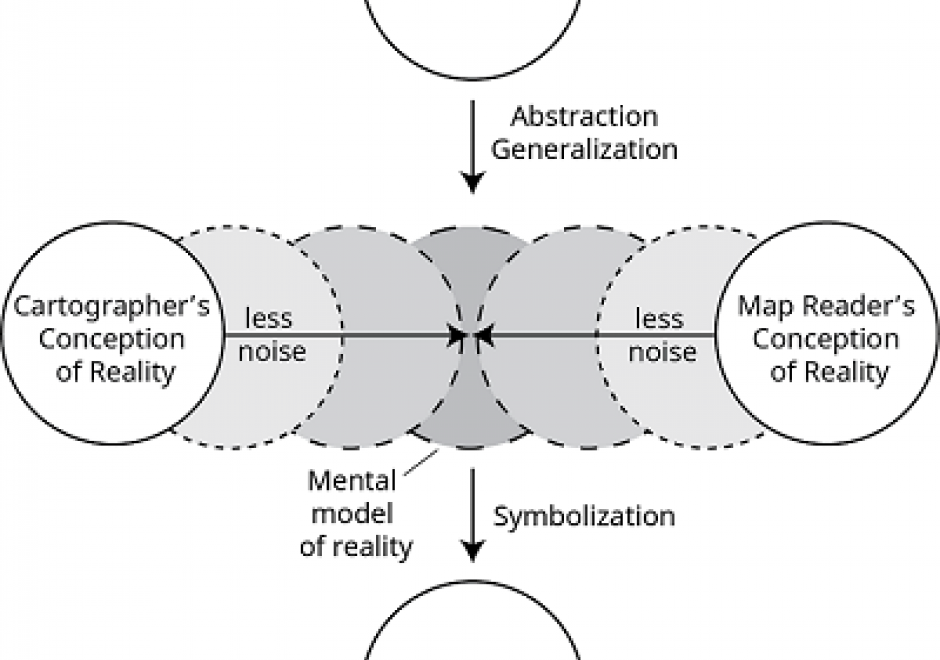
The largest contributing factor to spatial data uncertainty is error. Error is defined as the departure of a measure from its true value. Uncertainty results from: (1) a lack of knowledge of the extent and of the expression of errors and  (2) their propagation through analyses. Understanding error and its sources is key to addressing error-based uncertainty in geospatial practice. This entry presents a sample of issues related to error and error based uncertainty in spatial data. These consist of (1) types of error in spatial data, (2) the special case of scale and its relationship to error and (3) approaches to quantifying error in spatial data.

CV-19 - Big Data Visualization
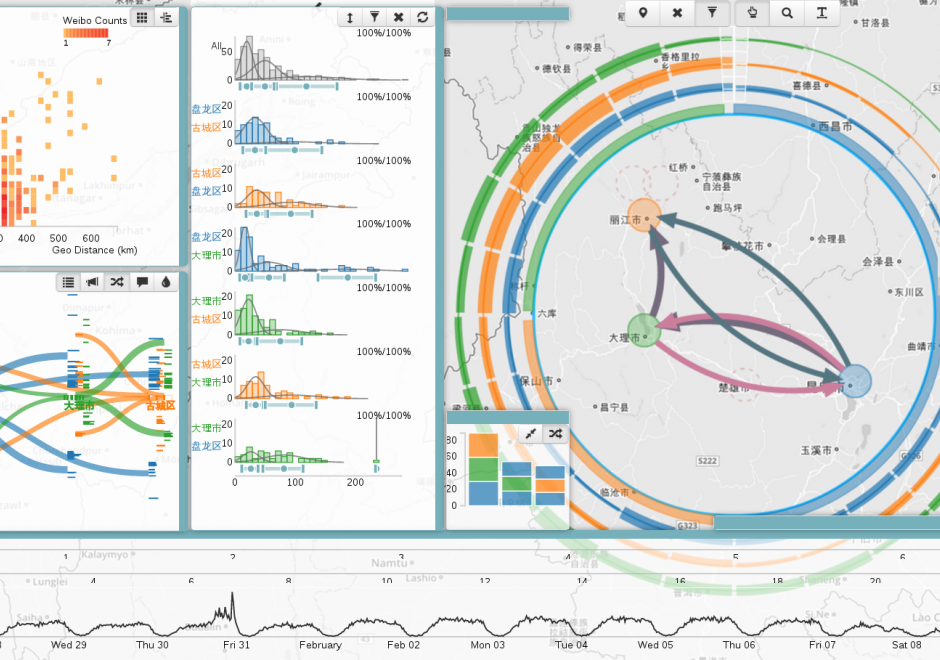
As new information and communication technologies have altered so many aspects of our daily lives over the past decades, they have simultaneously stimulated a shift in the types of data that we collect, produce, and analyze. Together, this changing data landscape is often referred to as "big data." Big data is distinguished from "small data" not only by its high volume but also by the velocity, variety, exhaustivity, resolution, relationality, and flexibility of the datasets. This entry discusses the visualization of big spatial datasets. As many such datasets contain geographic attributes or are situated and produced within geographic space, cartography takes on a pivotal role in big data visualization. Visualization of big data is frequently and effectively used to communicate and present information, but it is in making sense of big data – generating new insights and knowledge – that visualization is becoming an indispensable tool, making cartography vital to understanding geographic big data. Although visualization of big data presents several challenges, human experts can use visualization in general, and cartography in particular, aided by interfaces and software designed for this purpose, to effectively explore and analyze big data.

CV-11 - Common Thematic Map Types

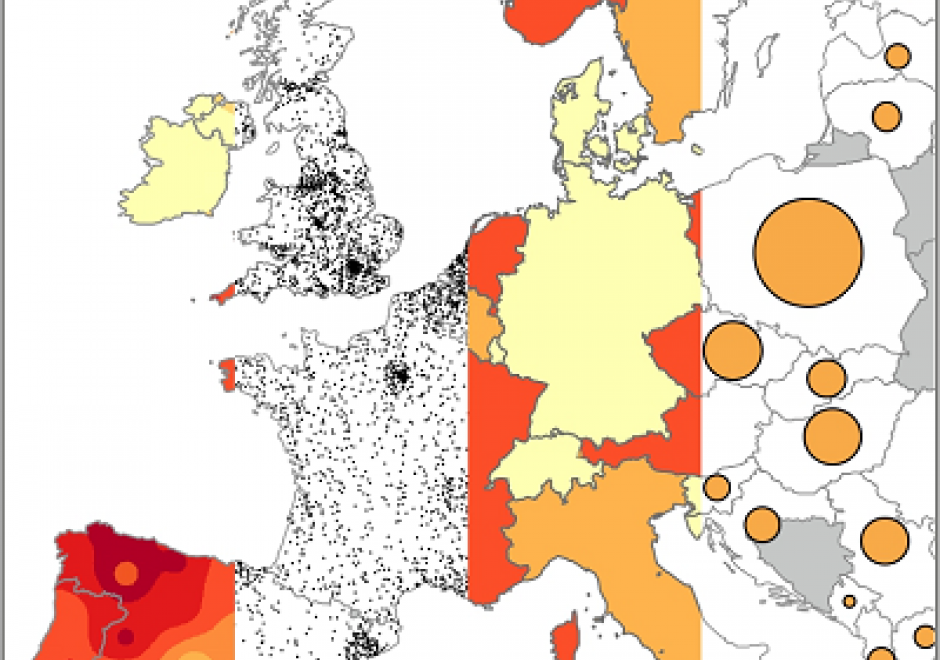
Thematic maps cover a wide variety of mapping solutions, and include choropleth, proportional symbol, isoline, dot density, dasymetric, and flow maps as well as cartograms, among others. Each thematic map type requires a different data processing method and employs different visual variables, resulting in representations that are either continuous or discrete and smooth or abrupt. As a result, each solution highlights different aspects of the mapped phenomena and shapes the message for the map readers differently. Thematic maps are tools for understanding spatial patterns, and the choice of thematic map type should support this understanding. Therefore, the main consideration when selecting a thematic map type is the purpose of the map and the nature of the underlying spatial patterns.

This entry reviews the common types of thematic maps, describes the visual variables that are applied in them, and provides design considerations for each thematic map type, including their legends. It also provides an overview of the relative strengths and limitations of each thematic map type.

CV-10 - Typography

The selection of appropriate type on maps, far from an arbitrary design decision, is an integral part of establishing the content and tone of the map. Typefaces have personalities, which contribute to the rhetorical message of the map. It is important to understand how to assess typefaces for their personalities, but also to understand which typefaces may be more or less legible in a labeling context. Beyond the choice of typeface, effective map labels will have a visual hierarchy and allow the user to easily associate labels to their features and feature types. The cartographer must understand and modify typographic visual variables to support both the hierarchy and label-feature associations.

CV-17 - Spatiotemporal Representation

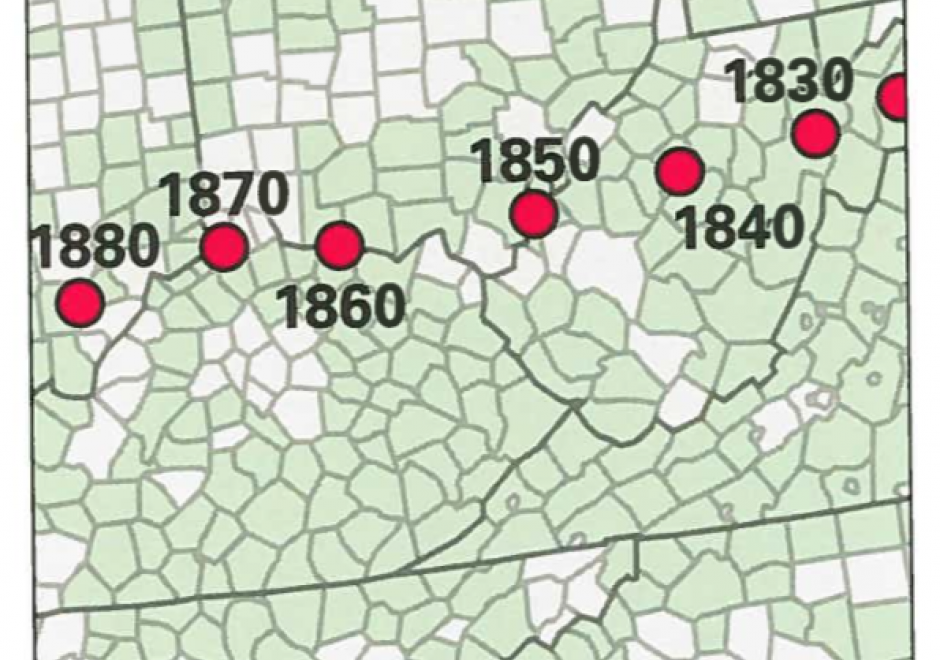
Space and time are integral components of geographic information. There are many ways in which to conceptualize space and time in the geographic realm that stem from time geography research in the 1960s. Cartographers and geovisualization experts alike have grappled with how to represent spatiotemporal data visually. Four broad types of mapping techniques allow for a variety of representations of spatiotemporal data: (1) single static maps, (2) multiple static maps, (3) single dynamic maps, and (4) multiple dynamic maps. The advantages and limitations of these static and dynamic methods are discussed in this entry. For cartographers, identifying the audience and purpose, medium, available data, and available time to design the map are vital aspects to deciding between the different spatiotemporal mapping techniques. However, each of these different mapping techniques offers its own advantages and disadvantages to the cartographer and the map reader. This entry focuses on the mapping of time and spatiotemporal data, the types of time, current methods of mapping, and the advantages and limitations of representing spatiotemporal data.

CV-01 - Cartography and Science

"Science" is used both to describe a general, systematic approach to understanding the world and to refer to that approach as it is applied to a specific phenomenon of interest, for example, "geographic information science." The scientific method is used to develop theories that explain phenomena and processes. It consists of an iterative cycle of several steps: proposing a hypothesis, devising a way to make empirical observations that test that hypothesis, and finally, refining the hypothesis based on the empirical observations. "Scientific cartography" became a dominant mode of cartographic research and inquiry after World War II, when there was increased focus on the efficacy of particular design decisions and how particular maps were understood by end users. This entry begins with a brief history of the development of scientific cartographic approaches, including how they are deployed in map design research today. Next it discusses how maps have been used by scientists to support scientific thinking. Finally, it concludes with a discussion of how maps are used to communicate the results of scientific thinking.

DM-70 - Problems of Large Spatial Databases

Large spatial databases often labeled as geospatial big data exceed the capacity of commonly used computing systems as a result of data volume, variety, velocity, and veracity. Additional problems also labeled with V’s are cited, but the four primary ones are the most problematic and focus of this chapter (Li et al., 2016, Panimalar et al., 2017).  Sources include satellites, aircraft and drone platforms, vehicles, geosocial networking services, mobile devices, and cameras. The problems in processing these data to extract useful information include query, analysis, and visualization. Data mining techniques and machine learning algorithms, such as deep convolutional neural networks, often are used with geospatial big data. The obvious problem is handling the large data volumes, particularly for input and output operations, requiring parallel read and write of the data, as well as high speed computers, disk services, and network transfer speeds. Additional problems of large spatial databases include the variety and heterogeneity of data requiring advanced algorithms to handle different data types and characteristics, and integration with other data. The velocity at which the data are acquired is a challenge, especially using today’s advanced sensors and the Internet of Things that includes millions of devices creating data on short temporal scales of micro seconds to minutes. Finally, the veracity, or truthfulness of large spatial databases is difficult to establish and validate, particularly for all data elements in the database.

Pages