GS-27 - GIS&T for Equity and Social Justice

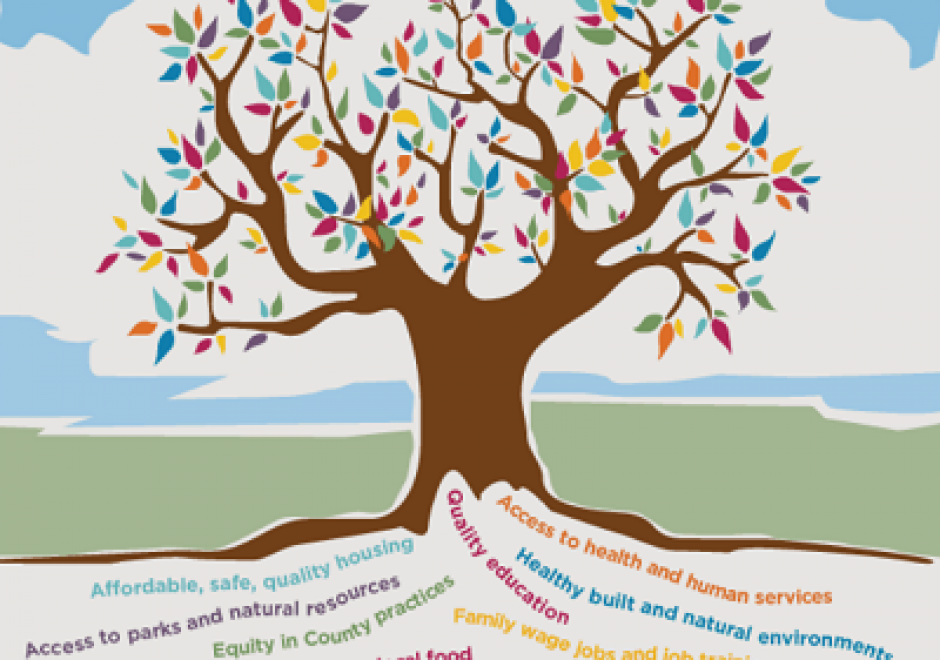
A geographic information system (GIS) can be used effectively for activities, programs, and analyses focused on equity and social justice (ESJ). Many types of inequities exist in society, but race and space are key predictors of inequity. A key concept of social justice is that any person born into society, no matter where they were born or live, will have an equitable opportunity to achieve successful life outcomes and to thrive. Geographic information science and its technologies (GIS&T) provide powerful tools to analyze equity and social justice issues and help government agencies apply an equity lens to every aspect of their administration. Given the reliance on spatial data to represent and analyze matters of ESJ, the use of these tools is necessary, logical, and appropriate. Some types of analyses and mapping commonly used with ESJ programs require careful attention to how data are combined and represented, risking misleading or false conclusions otherwise. Such outcomes could build mistrust when trust is most needed. A GIS-supported lifecycle for ESJ is presented that includes stages of exploratory issue analysis, community feedback, pro-equity programs analysis, management monitoring and stakeholder awareness, program performance metrics, and effectiveness analysis.

DM-85 - Point, Line, and Area Generalization
Generalization is an important and unavoidable part of making maps because geographic features cannot be represented on a map without undergoing transformation. Maps abstract and portray features using vector (i.e. points, lines and polygons) and raster (i.e pixels) spatial primitives which are usually labeled. These spatial primitives are subjected to further generalization when map scale is changed. Generalization is a contradictory process. On one hand, it alters the look and feel of a map to improve overall user experience especially regarding map reading and interpretive analysis. On the other hand, generalization has documented quality implications and can sacrifice feature detail, dimensions, positions or topological relationships. A variety of techniques are used in generalization and these include selection, simplification, displacement, exaggeration and classification. The techniques are automated through computer algorithms such as Douglas-Peucker and Visvalingam-Whyatt in order to enhance their operational efficiency and create consistent generalization results. As maps are now created easily and quickly, and used widely by both experts and non-experts owing to major advances in IT, it is increasingly important for virtually everyone to appreciate the circumstances, techniques and outcomes of generalizing maps. This is critical to promoting better map design and production as well as socially appropriate uses.