Search Page

Showing 1 - 5 of 5
CV-04 - Scale and Generalization

Scale and generalization are two fundamental, related concepts in geospatial data. Scale has multiple meanings depending on context, both within geographic information science and in other disciplines. Typically it refers to relative proportions between objects in the real world and their representations. Generalization is the act of modifying detail, usually reducing it, in geospatial data. It is often driven by a need to represent data at coarsened resolution, being typically a consequence of reducing representation scale. Multiple computations and graphical modication processes can be used to achieve generalization, each introducing increased abstraction to the data, its symbolization, or both.

CV-40 - Mobile Maps and Responsive Design
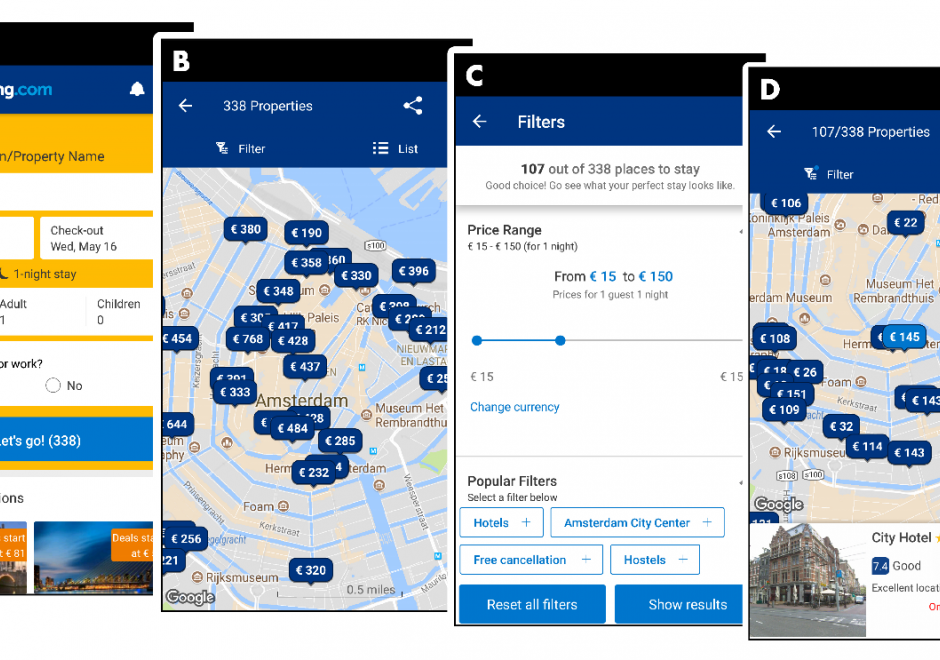
Geographic information increasingly is produced and consumed on mobile devices. The rise of mobile mapping is challenging traditional design conventions in research, industry, and education, and cartographers and GIScientists now need to accommodate this mobile context. This entry introduces emerging design considerations for mobile maps. First, the technical enablements and constraints that make mobile devices unique are described, including Global Positioning System (GPS) receivers and other sensors, reduced screensize and resolution, reduced processing power and memory capacity, less reliable data connectivity, reduced bandwidth, and physical mobility through variable environmental conditions. Scholarly influences on mobile mapping also are reviewed, including location-based services, adaptive cartography, volunteered geographic information, and locational privacy. Next, two strategies for creating mobile maps are introduced—mobile apps installed onto mobile operating systems versus responsive web maps that work on mobile and nonmobile devices—and core concepts of responsive web design are reviewed, including fluid grids, media queries, breakpoints, and frameworks. Finally, emerging design recommendations for mobile maps are summarized, with representation design adaptations needed to account for reduced screensizes and bandwidth and interaction design adaptations needed to account for multi-touch interaction and post-WIMP interfaces.

CV-19 - Big Data Visualization

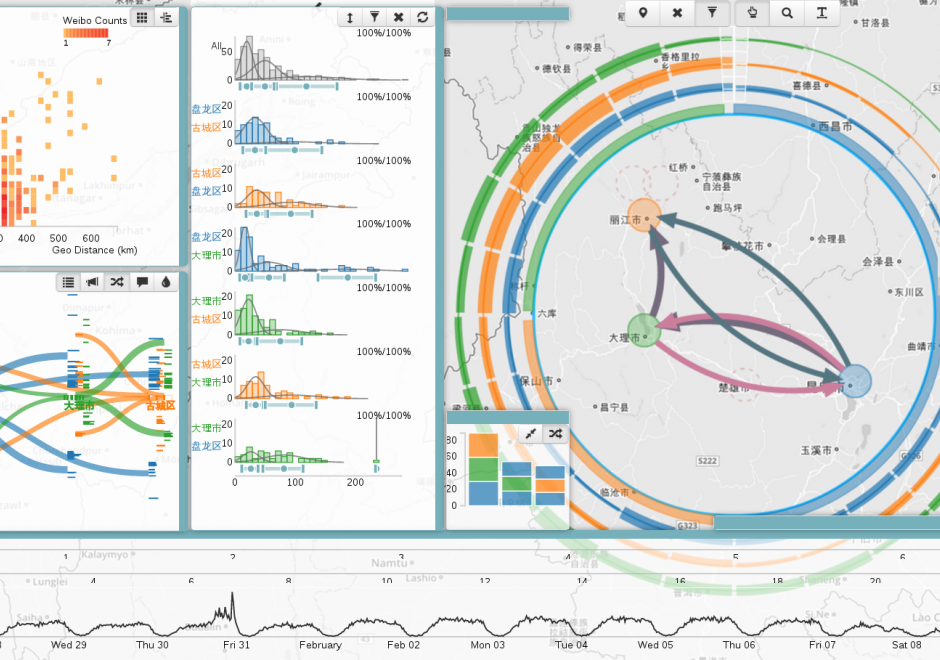
As new information and communication technologies have altered so many aspects of our daily lives over the past decades, they have simultaneously stimulated a shift in the types of data that we collect, produce, and analyze. Together, this changing data landscape is often referred to as "big data." Big data is distinguished from "small data" not only by its high volume but also by the velocity, variety, exhaustivity, resolution, relationality, and flexibility of the datasets. This entry discusses the visualization of big spatial datasets. As many such datasets contain geographic attributes or are situated and produced within geographic space, cartography takes on a pivotal role in big data visualization. Visualization of big data is frequently and effectively used to communicate and present information, but it is in making sense of big data – generating new insights and knowledge – that visualization is becoming an indispensable tool, making cartography vital to understanding geographic big data. Although visualization of big data presents several challenges, human experts can use visualization in general, and cartography in particular, aided by interfaces and software designed for this purpose, to effectively explore and analyze big data.

CV-10 - Typography

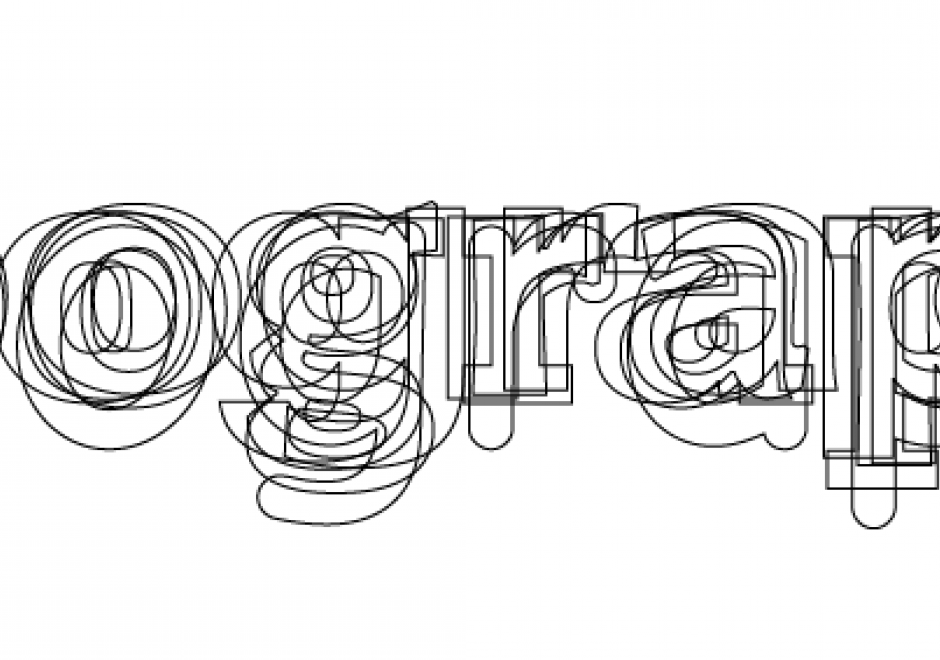
The selection of appropriate type on maps, far from an arbitrary design decision, is an integral part of establishing the content and tone of the map. Typefaces have personalities, which contribute to the rhetorical message of the map. It is important to understand how to assess typefaces for their personalities, but also to understand which typefaces may be more or less legible in a labeling context. Beyond the choice of typeface, effective map labels will have a visual hierarchy and allow the user to easily associate labels to their features and feature types. The cartographer must understand and modify typographic visual variables to support both the hierarchy and label-feature associations.

CV-17 - Spatiotemporal Representation

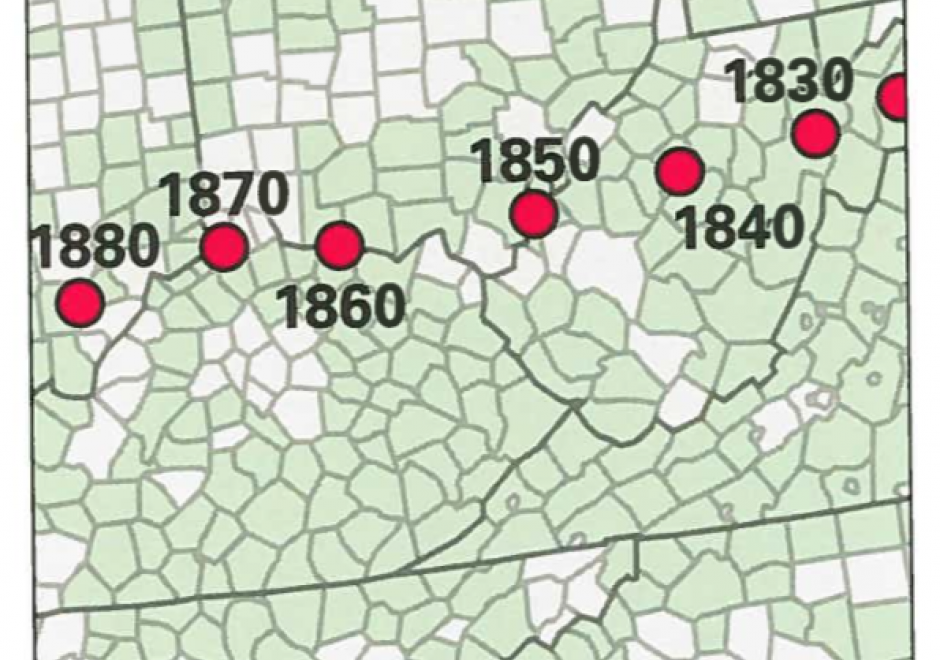
Space and time are integral components of geographic information. There are many ways in which to conceptualize space and time in the geographic realm that stem from time geography research in the 1960s. Cartographers and geovisualization experts alike have grappled with how to represent spatiotemporal data visually. Four broad types of mapping techniques allow for a variety of representations of spatiotemporal data: (1) single static maps, (2) multiple static maps, (3) single dynamic maps, and (4) multiple dynamic maps. The advantages and limitations of these static and dynamic methods are discussed in this entry. For cartographers, identifying the audience and purpose, medium, available data, and available time to design the map are vital aspects to deciding between the different spatiotemporal mapping techniques. However, each of these different mapping techniques offers its own advantages and disadvantages to the cartographer and the map reader. This entry focuses on the mapping of time and spatiotemporal data, the types of time, current methods of mapping, and the advantages and limitations of representing spatiotemporal data.