Search Page

Showing 1 - 5 of 5
CV-29 - Design and Aesthetics

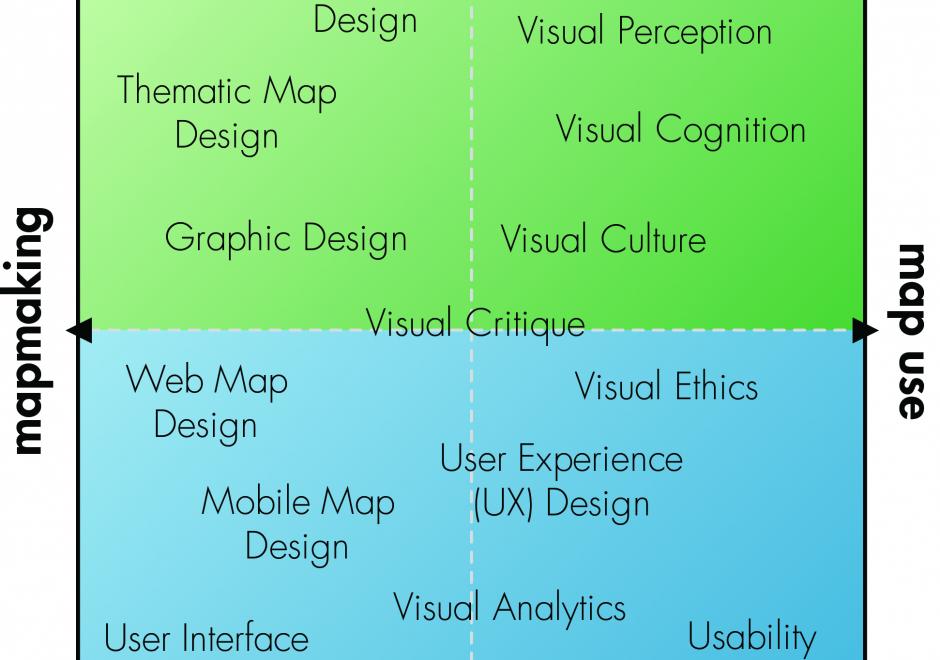
Design and aesthetics are fundamental to cartographic practice. Developing students’ skills in design and aesthetics is a critical part of cartography education, yet design is also one of the most difficult part of the cartographic process. The cartographic design process of planning, creating, critiquing, and revising maps provides a method for making maps with intentional design decisions, utilizing an understanding of aesthetics to promote clarity and cohesion to attract the user and facilitate an emotional response. In this entry, cartographic design and the cartographic design process are reviewed, and the concepts of aesthetics, style, and taste are explained in the context of cartographic design.

CV-03 - Vector Formats and Sources
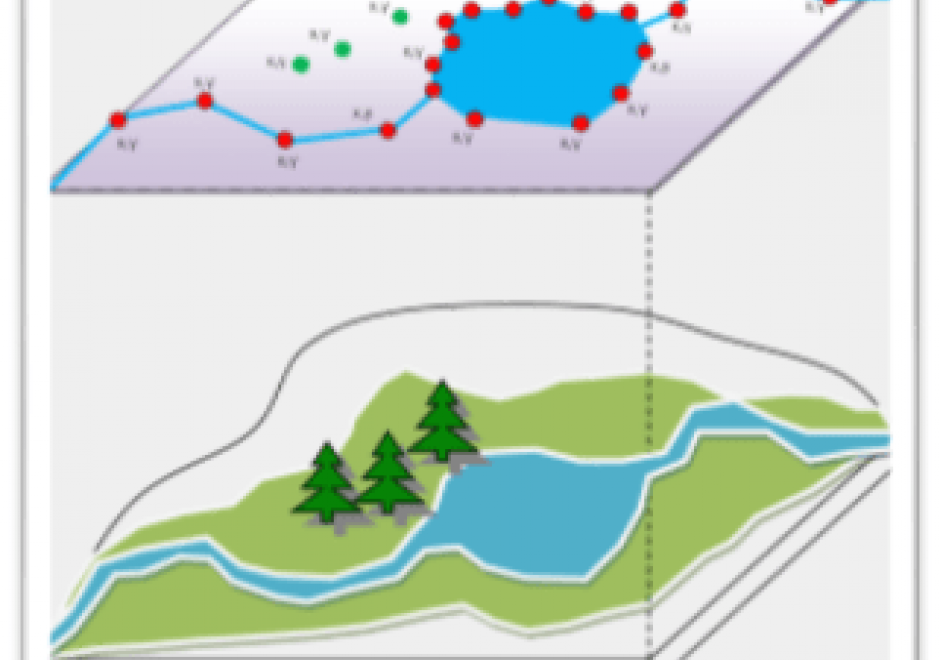
In the last ten years, the rise of efficient computing devices with significant processing power and storage has caused a surge in digital data collection and publication. As more software programs and hardware devices are released, we are not only seeing an increase in available data, but also an increase in available data formats. Cartographers today have access to a wide range of interesting datasets, and online portals for downloading geospatial data now frequently offer that data in several different formats. This chapter provides information useful to modern cartographers working with vector data, including an overview of common vector data formats (e.g. shapefile, GeoJSON, file geodatabase); their relative benefits, idiosyncrasies, and limitations; and a list of popular sources for geospatial vector data (e.g. United States Census Bureau, university data warehouses).

CV-30 - Map Production and Management

Map production describes the experience of managing the many aspects and details of map creation. Often the map product is created for someone else—a client, supervisor, or instructor. Describing the intention of the map and evaluating available resources ahead of the project can help the cartographer define content requirements, stay on task, and ultimately meet deadlines. The project management life cycle involves clear communication between the cartographer and client, with resolutions to common questions best addressed at the beginning of the project. The process then iteratively cycles through phases that include research and production, followed by quality control, and concludes with file preparation and delivery.

CV-13 - User Interface and User Experience (UI/UX) Design

Advances in personal computing and information technologies have fundamentally transformed how maps are produced and consumed, as many maps today are highly interactive and delivered online or through mobile devices. Accordingly, we need to consider interaction as a fundamental complement to representation in cartography and visualization. UI (user interface) / UX (user experience) describes a set of concepts, guidelines, and workflows for critically thinking about the design and use of an interactive product, map or otherwise. This entry introduces core concepts from UI/UX design important to cartography and visualization, focusing on issues related to visual design. First, a fundamental distinction is made between the use of an interface as a tool and the broader experience of an interaction, a distinction that separates UI design and UX design. Norman’s stages of interaction framework then is summarized as a guiding model for understanding the user experience with interactive maps, noting how different UX design solutions can be applied to breakdowns at different stages of the interaction. Finally, three dimensions of UI design are described: the fundamental interaction operators that form the basic building blocks of an interface, interface styles that implement these operator primitives, and recommendations for visual design of an interface.

CV-31 - Flow Maps

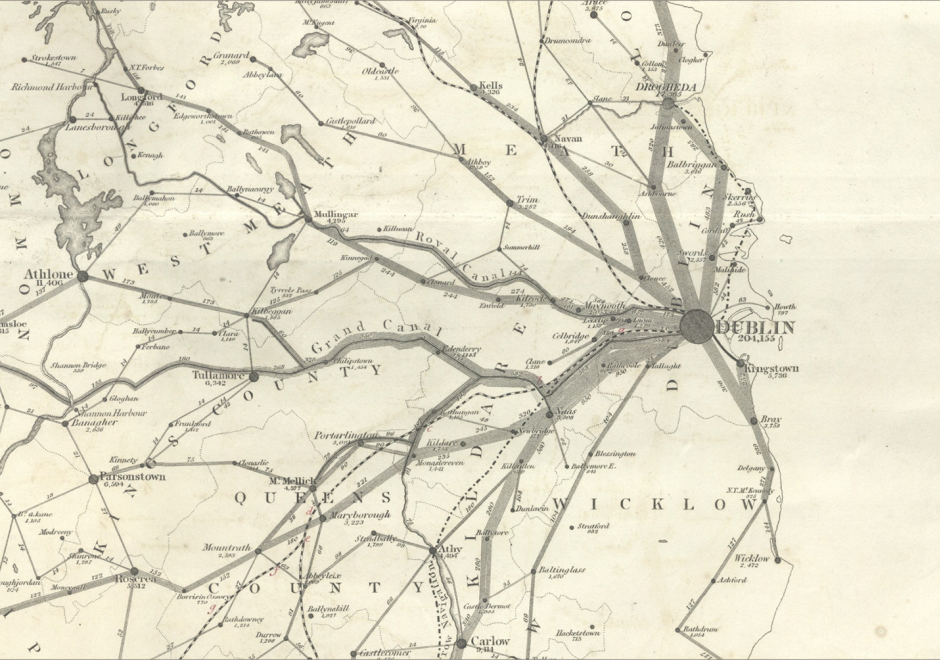
Flow mapping is a cartographic method of representing movement of phenomena. Maps of this type often depict the vector movement of entities (imports and exports, people, information) between geographic areas, but the general method also encompasses a range of graphics illustrating networks (e.g., transit and communications grids) and dynamic systems (e.g., wind and water currents). Most flow maps typically use line symbols of varying widths, lengths, shapes, colors, or speeds (in the case of animated flow maps) to show the quality, direction, and magnitude of movements. Aesthetic considerations for flow maps are numerous and their production is often done manually without significant automation. Flow maps frequently use distorted underlying geography to accommodate the placement of flow paths, which are often dramatically smoothed/abstracted into visually pleasing curves or simply straight lines. In the extreme, such maps lack a geographic coordinate space and are more diagrammatic, as in Sankey diagrams, alluvial diagrams, slope graphs, and circle migration plots. Whatever their form, good flow maps should effectively visualize the relative magnitude and direction of movement or potential movement between a one or more origins and destinations.