CV-01 - Cartography and Science

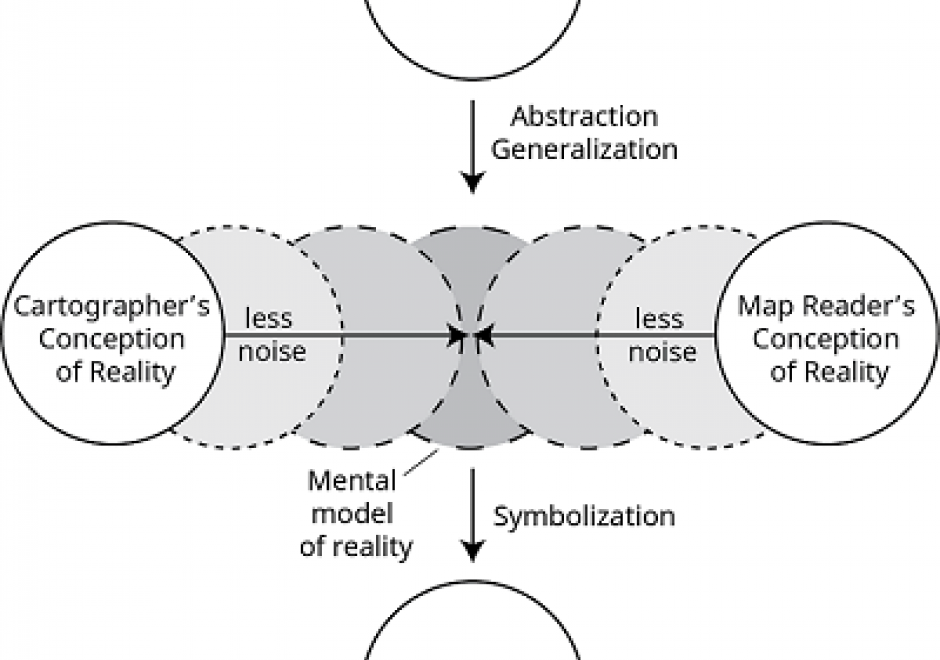
"Science" is used both to describe a general, systematic approach to understanding the world and to refer to that approach as it is applied to a specific phenomenon of interest, for example, "geographic information science." The scientific method is used to develop theories that explain phenomena and processes. It consists of an iterative cycle of several steps: proposing a hypothesis, devising a way to make empirical observations that test that hypothesis, and finally, refining the hypothesis based on the empirical observations. "Scientific cartography" became a dominant mode of cartographic research and inquiry after World War II, when there was increased focus on the efficacy of particular design decisions and how particular maps were understood by end users. This entry begins with a brief history of the development of scientific cartographic approaches, including how they are deployed in map design research today. Next it discusses how maps have been used by scientists to support scientific thinking. Finally, it concludes with a discussion of how maps are used to communicate the results of scientific thinking.


CV-11 - Common Thematic Map Types
Thematic maps cover a wide variety of mapping solutions, and include choropleth, proportional symbol, isoline, dot density, dasymetric, and flow maps as well as cartograms, among others. Each thematic map type requires a different data processing method and employs different visual variables, resulting in representations that are either continuous or discrete and smooth or abrupt. As a result, each solution highlights different aspects of the mapped phenomena and shapes the message for the map readers differently. Thematic maps are tools for understanding spatial patterns, and the choice of thematic map type should support this understanding. Therefore, the main consideration when selecting a thematic map type is the purpose of the map and the nature of the underlying spatial patterns.
This entry reviews the common types of thematic maps, describes the visual variables that are applied in them, and provides design considerations for each thematic map type, including their legends. It also provides an overview of the relative strengths and limitations of each thematic map type.