2019 QUARTER 04

A B C D E F G H I K L M N O P R S T U V W
CV-40 - Mobile Maps and Responsive Design

Geographic information increasingly is produced and consumed on mobile devices. The rise of mobile mapping is challenging traditional design conventions in research, industry, and education, and cartographers and GIScientists now need to accommodate this mobile context. This entry introduces emerging design considerations for mobile maps. First, the technical enablements and constraints that make mobile devices unique are described, including Global Positioning System (GPS) receivers and other sensors, reduced screensize and resolution, reduced processing power and memory capacity, less reliable data connectivity, reduced bandwidth, and physical mobility through variable environmental conditions. Scholarly influences on mobile mapping also are reviewed, including location-based services, adaptive cartography, volunteered geographic information, and locational privacy. Next, two strategies for creating mobile maps are introduced—mobile apps installed onto mobile operating systems versus responsive web maps that work on mobile and nonmobile devices—and core concepts of responsive web design are reviewed, including fluid grids, media queries, breakpoints, and frameworks. Finally, emerging design recommendations for mobile maps are summarized, with representation design adaptations needed to account for reduced screensizes and bandwidth and interaction design adaptations needed to account for multi-touch interaction and post-WIMP interfaces.

DM-21 - Modeling three-dimensional (3-D) entities
  • Identify GIS application domains in which true 3-D models of natural phenomena are necessary
  • Illustrate the use of Virtual Reality Modeling Language (VRML) to model landscapes in 3-D
  • Explain how octatrees are the 3-D extension of quadtrees
  • Explain how voxels and stack-unit maps that show the topography of a series of geologic layers might be considered 3-D extensions of field and vector representations respectively
  • Explain how 3-D models can be extended to additional dimensions
  • Explain the use of multi-patching to represent 3-D objects
  • Explain the difficulties in creating true 3-D objects in a vector or raster format
  • Differentiate between 21/2-D representations and true 3-D models
DM-19 - Modeling uncertainty
  • Differentiate among modeling uncertainty for entire datasets, for features, and for individual data values
  • Describe SQL extensions for querying uncertainty information in databases
  • Describe extensions to relational DBMS to represent different types of uncertainty in attributes, including both vagueness/fuzziness and error-based uncertainty
  • Discuss the role of metadata in representing and communicating dataset-level uncertainty
  • Create a GIS database that models uncertain information
  • Identify whether it is important to represent uncertainty in a particular GIS application
  • Describe the architecture of data models (both field- and object-based) to represent feature-level and datum-level uncertainty
  • Evaluate the advantages and disadvantages of existing uncertainty models based on storage efficiency, query performance, ease of data entry, and ability to implement in existing software
AM-44 - Modelling Accessibility

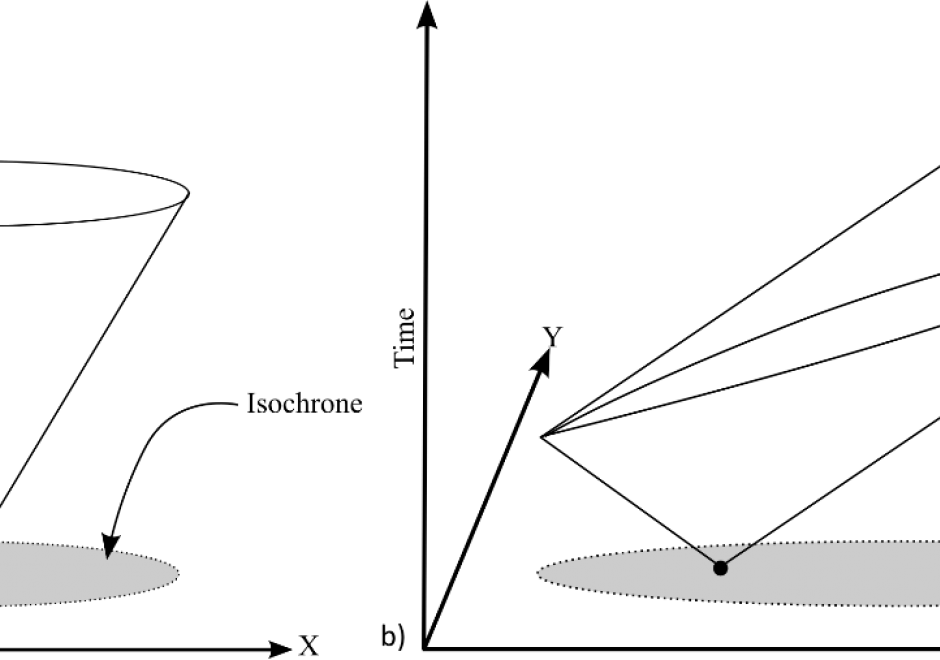
Modelling accessibility involves combining ideas about destinations, distance, time, and impedances to measure the relative difficulty an individual or aggregate region faces when attempting to reach a facility, service, or resource. In its simplest form, modelling accessibility is about quantifying movement opportunity. Crucial to modelling accessibility is the calculation of the distance, time, or cost distance between two (or more) locations, which is an operation that geographic information systems (GIS) have been designed to accomplish. Measures and models of accessibility thus draw heavily on the algorithms embedded in a GIS and represent one of the key applied areas of GIS&T.

AM-13 - Multi-criteria evaluation
  • Describe the implementation of an ordered weighting scheme in a multiple-criteria aggregation
  • Compare and contrast the terms multi-criteria evaluation, weighted linear combination, and site suitability analysis
  • Differentiate between contributing factors and constraints in a multi-criteria application
  • Explain the legacy of multi-criteria evaluation in relation to cartographic modeling
  • Determine which method to use to combine criteria (e.g., linear, multiplication)
  • Create initial weights using the analytical hierarchy process (AHP)
  • Calibrate a linear combination model by adjusting weights using a test data set
AM-66 - Multi-layer feed-forward neural networks
  • Analyze the stability of the network using multiple runs with the same training data and architecture
  • Compare and contrast classification results when the architecture of the network and initial parameters are changed
  • Differentiate between feed-forward and recurrent architectures
  • Describe the architecture and components of a feed-forward neural network
KE-34 - Multi-Organizational GIS Coordination

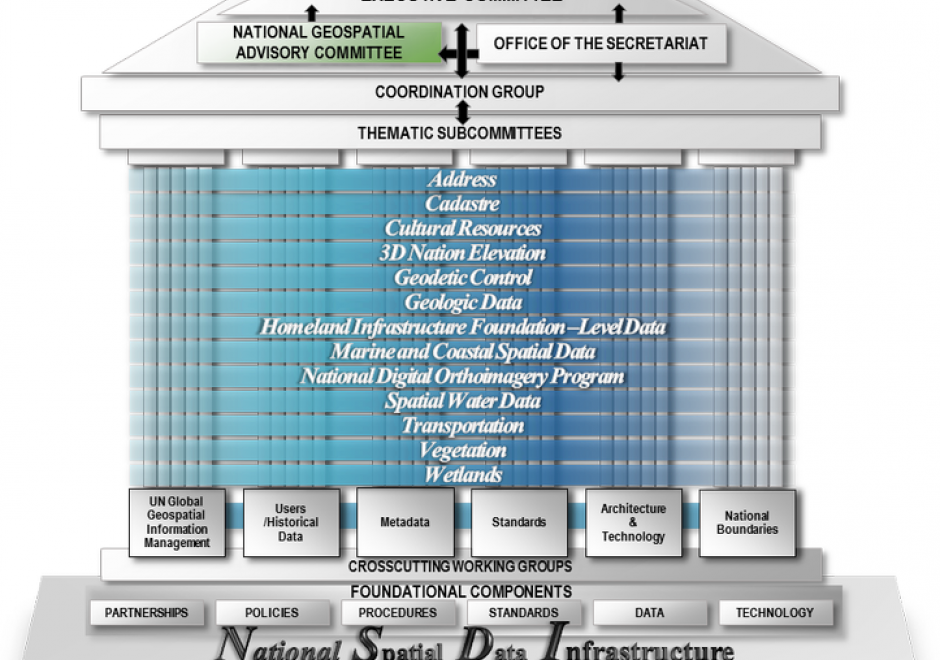
For many years, collaboration has been a key cornerstone in the success of efforts achieved by the geospatial community.  When paired with governance, collaborative efforts often lead to sustainability and have the effect of broadening the benefits that can be achieved.  The following text shares how the geospatial community uses collaboration and governance as tools to achieve benefits across the community.  Case studies are provided to illustrate the process and the outcomes achieved. 

DC-16 - Nature of Multispectral Image Data

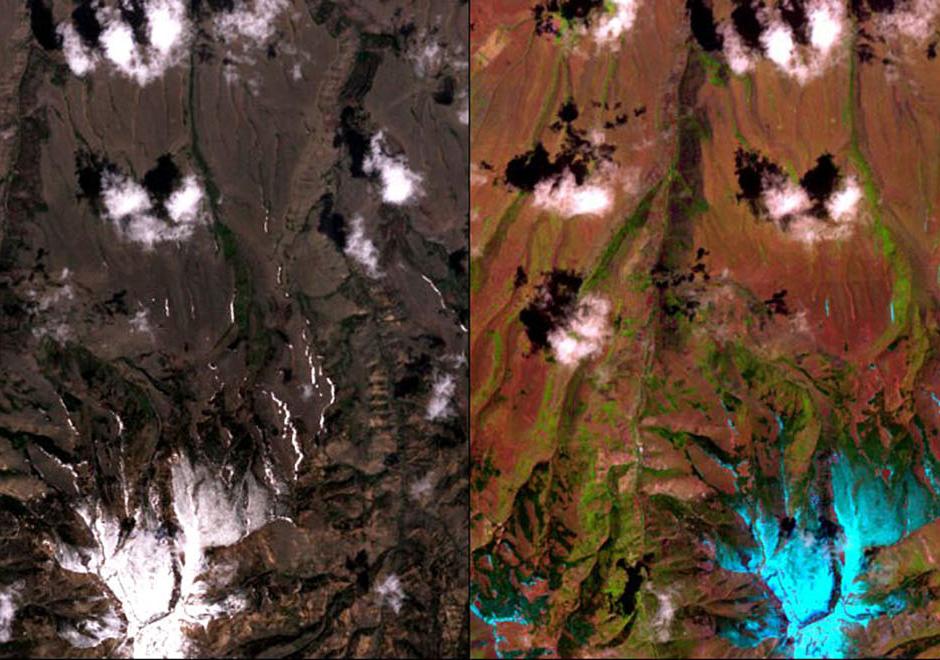
A multispectral image comprises a set of co-registered images, each of which captures the spatially varying brightness of a scene in a specific spectral band, or electromagnetic wavelength region. An image is structured as a raster, or grid, of pixels. Multispectral images are used as a visual backdrop for other GIS layers, to provide information that is manually interpreted from images, or to generate automatically-derived thematic layers, for example through classification. The scale of multispectral images has spatial, spectral, radiometric and temporal components. Each component of scale has two aspects, extent (or coverage), and grain (or resolution). The brightness variations of an image are determined by factors that include (1) illumination variations and effects of the atmosphere, (2) spectral properties of materials in the scene (particularly reflectance, but also, depending on the wavelength, emittance), (3) spectral bands of the sensor, and (4) display options, such as the contrast stretch, which affect the visualization of the image. This topic review focuses primarily on optical remote sensing in the visible, near infrared and shortwave infrared parts of the electromagnetic spectrum, with an emphasis on satellite imagery.  

AM-05 - Neighborhoods

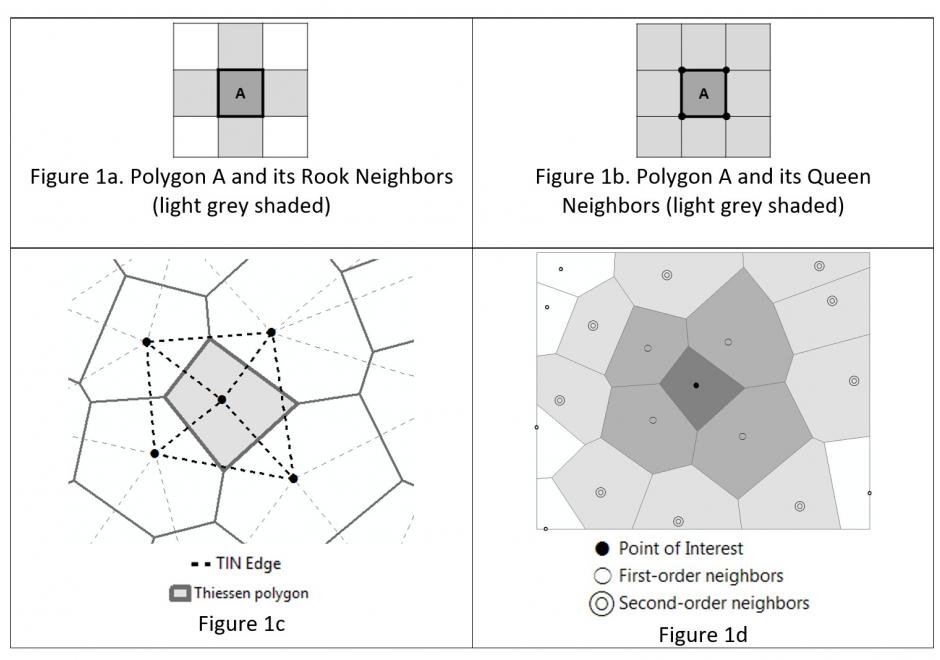
Neighborhoods mean different things in varied contexts like computational geometry, administration and planning, as well as urban geography and other fields. Among the multiple contexts, computational geometry takes the most abstract and data-oriented approach: polygon neighborhoods refer to polygons sharing a boundary or a point, and point neighborhoods are defined by connected Thiessen polygons or other more complicated algorithms. Neighborhoods in some regions can be a practical and clearly delineated administration or planning units. In urban geography and some related social sciences, the terms neighborhood and community have been used interchangeably on many occasions, and neighborhoods can be a fuzzy and general concept with no clear boundaries such that they cannot be easily or consensually defined. Neighborhood effects have a series of unique meanings and several delineation methods are commonly used to define social and environmental effects in health applications.

Pages