2023 QUARTER 01

A B C D E F G H I J K L M N O P R S T U V W
DC-19 - Ground Verification and Accuracy Assessment

Spatial products such as maps of land cover, soil type, wildfire, glaciers, and surface water have become increasingly available and used in science and policy decisions.  These maps are not without error, and it is critical that a description of quality accompany each product.  In the case of a thematic map, one aspect of quality is obtained by conducting a spatially explicit accuracy assessment in which the map class and reference class are compared on a per spatial unit basis (e.g., per 30m x 30m pixel).  The outcome of an accuracy assessment is a description of quality of the end-product map, in contrast to conducting an evaluation of map quality as part of the map production process.  The accuracy results can be used to decide if the map is of adequate quality for an intended application, as input to uncertainty analyses, and as information to improve future map products.

DM-11 - Hierarchical data models
  • Illustrate the quadtree model
  • Describe the advantages and disadvantages of the quadtree model for geographic database representation and modeling
  • Describe alternatives to quadtrees for representing hierarchical tessellations (e.g., hextrees, rtrees, pyramids)
  • Explain how quadtrees and other hierarchical tessellations can be used to index large volumes of raster or vector data
  • Implement a format for encoding quadtrees in a data file
CP-03 - High performance computing
  • Describe how the power increase in desktop computing has expanded the analytic methods that can be used for GIS&T
  • Exemplify how the power increase in desktop computing has expanded the analytic methods that can be used for GIS&T
DC-36 - Historical Maps in GIS

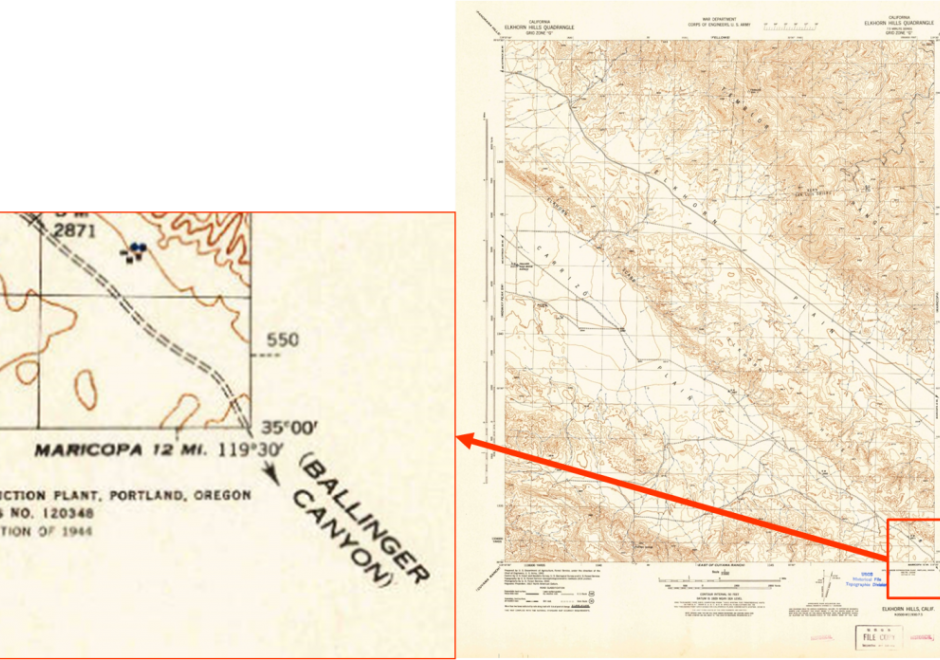
The use of historical maps in coordination with GIS aids scholars who are approaching a geographical study in which an historical approach is required or is interested in the geographical relationships between different historical representations of the landscape in cartographic document.  Historical maps allow the comparison of spatial relationships of past phenomena and their evolution over time and permit both qualitative and quantitative diachronic analysis. In this chapter, an explanation of the use of historical maps in GIS for the study of landscape and environment is offered. After a short theoretical introduction on the meaning of the term “historical map,” the reader will find the key steps in using historic maps in a GIS, a brief overview on the challenges in interpretation of historical maps, and some example applications.

DM-52 - Horizontal (Geometric) Datums

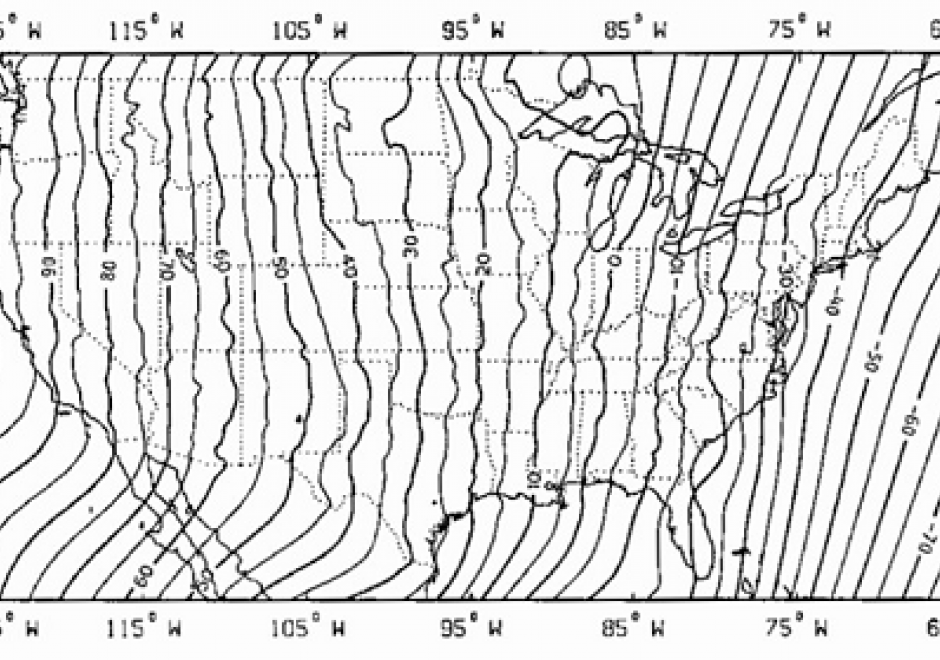
A horizontal (geometric) datum provides accurate coordinates (e.g., latitude and longitude) for points on Earth’s surface. Historically, surveyors developed a datum using optically sighted instruments to manually place intervisible survey marks in the ground. This survey work incorporated geometric principles of baselines, distances, and azimuths through the process of triangulation to attach a coordinate value to each survey mark. Triangulation produced a geodetic network of interconnected survey marks that realized the datum (i.e., connecting the geometry of the network to Earth’s physical surface). For local surveys, these datums provided reasonable positional accuracies on the order of meters. Importantly, once placed in the ground, these survey marks were passive; a new survey was needed to determine any positional changes (e.g., due to plate motion) and to update the attached coordinate values. Starting in the 1950s, due to the implementation of active control, space-based satellite geodesy changed how geodetic networks were realized. Here, "active" implies that a survey mark’s coordinates are updated in near real-time through, for example, artificial satellites such as GNSS. Increasingly, GNSS and satellite geodesy is paving the way for a modernized geometric datum that is global in scope and capable of providing positional accuracies at the millimeter level.

DM-90 - Hydrographic Geospatial Data Standards

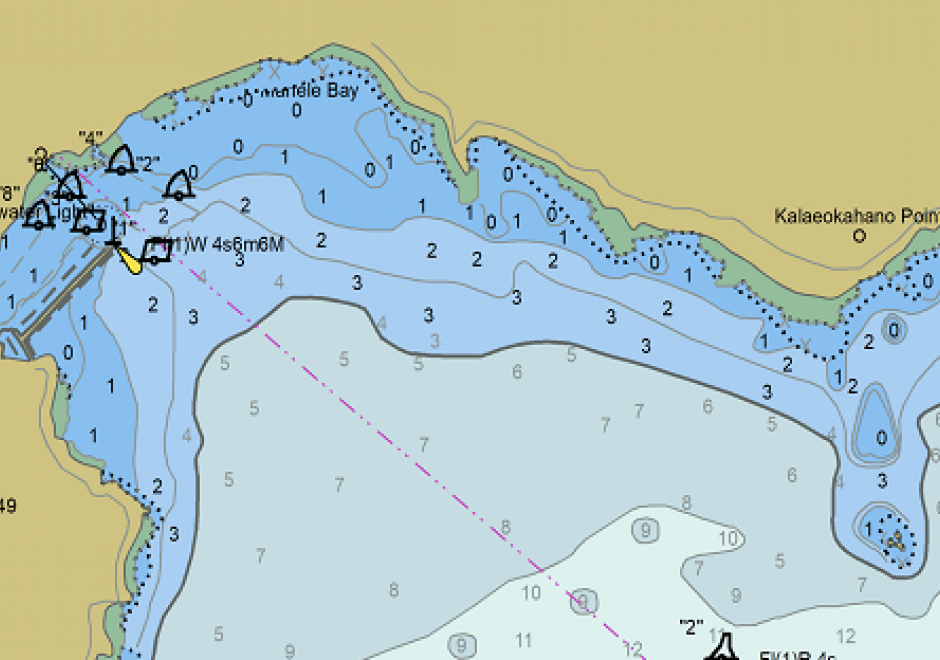
Coastal nations, through their dedicated Hydrographic Offices (HOs), have the obligation to provide nautical charts for the waters of national jurisdiction in support of safe maritime navigation. Accurate and reliable charts are essential to seafarers whether for commerce, defense, fishing, or recreation. Since navigation can be an international activity, mariners often use charts published from different national HOs. Standardization of data collection and processing, chart feature generalization methods, text, symbology, and output validation becomes essential in providing mariners with consistent and uniform products regardless of the region or the producing nation. Besides navigation, nautical charts contain information about the seabed and the coastal environment useful in other domains such as dredging, oceanography, geology, coastal modelling, defense, and coastal zone management. The standardization of hydrographic and nautical charting activities is achieved through various publications issued by the International Hydrographic Organization (IHO). This chapter discusses the purpose and importance of nautical charts, the establishment and role of the IHO in coordinating HOs globally, the existing hydrographic geospatial data standards, as well as those under development based on the new S-100 Universal Hydrographic Data Model.

GS-22 - Implications of distributed GIS&T
  • Describe the advantages and disadvantages to an organization in using GIS portal information from other organizations
  • Describe how inter-organization GIS portals may impact or influence issues related to social equity, privacy and data access
  • Discuss how distributed GIS&T may affect the nature of organizations and relationships among institutions
  • Suggest the possible societal and ethical implications of distributed GIS&T
AM-17 - Intervisibility, Line-of-Sight, and Viewsheds

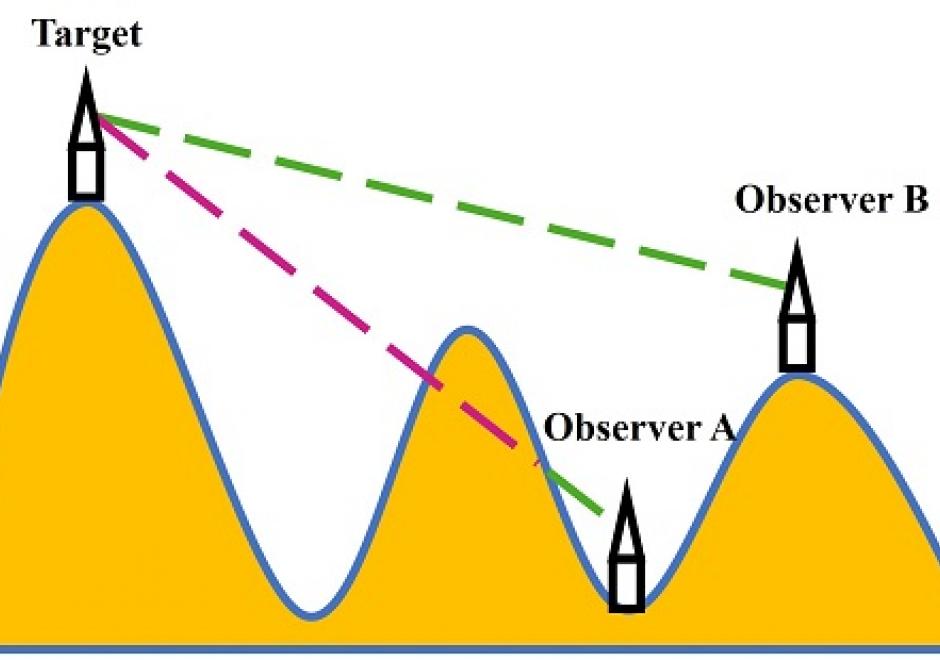
The visibility of a place refers to whether it can be seen by observers from one or multiple other locations. Modeling the visibility of points has various applications in GIS, such as placement of observation points, military observation, line-of-sight communication, optimal path route planning, and urban design. This chapter provides a brief introduction to visibility analysis, including an overview of basic conceptions in visibility analysis, the methods for computing intervisibility using discrete and continuous approaches based on DEM and TINs, the process of intervisibility analysis, viewshed and reverse viewshed analysis. Several practical applications involving visibility analysis are illustrated for geographical problem-solving. Finally, existing software and toolboxes for visibility analysis are introduced.

PD-32 - JavaScript for GIS

JavaScript (which has no connection to the Java computer language) is a popular high-level programming languages used to develop user interfaces in web pages. The principle goal of using JavaScript for programming web and mobile GIS applications is to build front-end applications that make use of spatial data and GIS principles, and in many cases, have embedded, interactive maps. It is considered much easier to program than Java or C languages for adding automation, animation, and interactivity into web pages and applications. JavaScript uses the leading browsers as runtime environments (RTE) and thus benefits from rapid and continuously evolving browser support for all web and mobile applications.

AM-08 - Kernels and Density Estimation

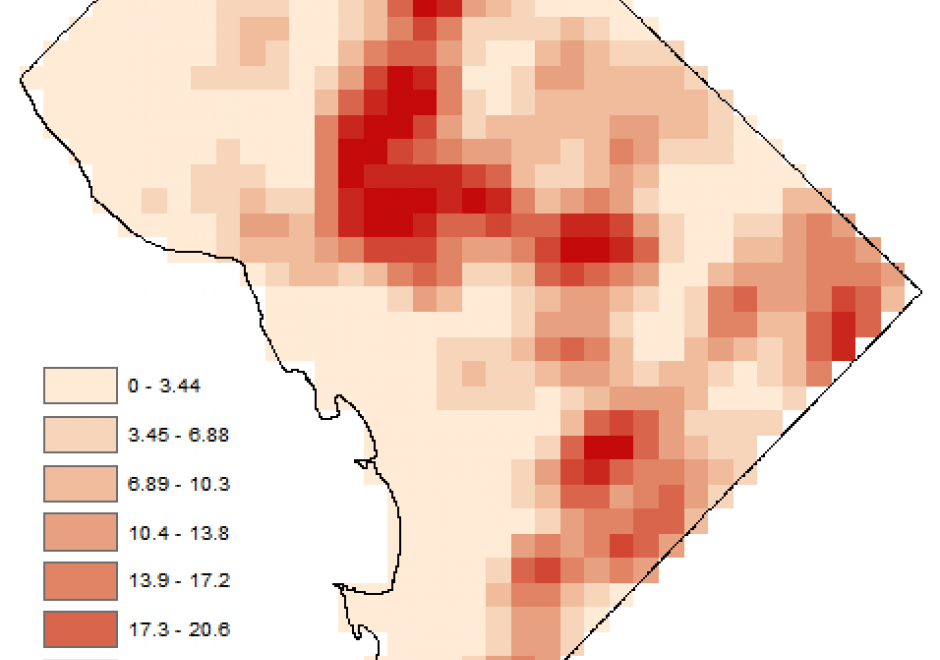
Kernel density estimation is an important nonparametric technique to estimate density from point-based or line-based data. It has been widely used for various purposes, such as point or line data smoothing, risk mapping, and hot spot detection. It applies a kernel function on each observation (point or line) and spreads the observation over the kernel window. The kernel density estimate at a location will be the sum of the fractions of all observations at that location. In a GIS environment, kernel density estimation usually results in a density surface where each cell is rendered based on the kernel density estimated at the cell center. The result of kernel density estimation could vary substantially depending on the choice of kernel function or kernel bandwidth, with the latter having a greater impact. When applying a fixed kernel bandwidth over all of the observations, undersmoothing of density may occur in areas with only sparse observation while oversmoothing may be found in other areas. To solve this issue, adaptive or variable bandwidth approaches have been suggested.

Pages