CV-01 - Cartography and Science

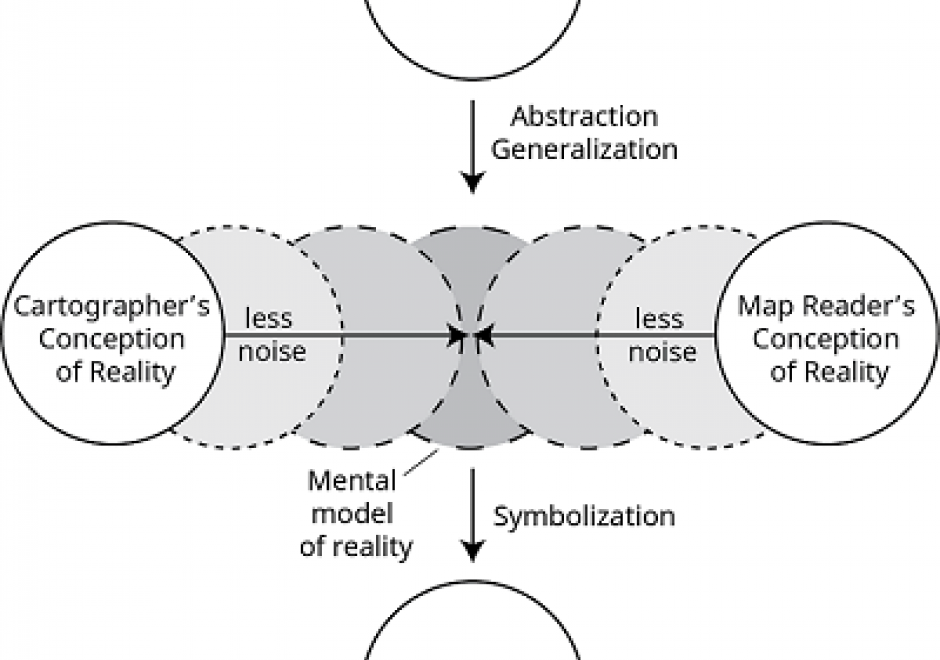
"Science" is used both to describe a general, systematic approach to understanding the world and to refer to that approach as it is applied to a specific phenomenon of interest, for example, "geographic information science." The scientific method is used to develop theories that explain phenomena and processes. It consists of an iterative cycle of several steps: proposing a hypothesis, devising a way to make empirical observations that test that hypothesis, and finally, refining the hypothesis based on the empirical observations. "Scientific cartography" became a dominant mode of cartographic research and inquiry after World War II, when there was increased focus on the efficacy of particular design decisions and how particular maps were understood by end users. This entry begins with a brief history of the development of scientific cartographic approaches, including how they are deployed in map design research today. Next it discusses how maps have been used by scientists to support scientific thinking. Finally, it concludes with a discussion of how maps are used to communicate the results of scientific thinking.


CV-19 - Big Data Visualization
As new information and communication technologies have altered so many aspects of our daily lives over the past decades, they have simultaneously stimulated a shift in the types of data that we collect, produce, and analyze. Together, this changing data landscape is often referred to as "big data." Big data is distinguished from "small data" not only by its high volume but also by the velocity, variety, exhaustivity, resolution, relationality, and flexibility of the datasets. This entry discusses the visualization of big spatial datasets. As many such datasets contain geographic attributes or are situated and produced within geographic space, cartography takes on a pivotal role in big data visualization. Visualization of big data is frequently and effectively used to communicate and present information, but it is in making sense of big data – generating new insights and knowledge – that visualization is becoming an indispensable tool, making cartography vital to understanding geographic big data. Although visualization of big data presents several challenges, human experts can use visualization in general, and cartography in particular, aided by interfaces and software designed for this purpose, to effectively explore and analyze big data.