Search Page

Showing 1 - 10 of 34
CV-04 - Scale and Generalization

Scale and generalization are two fundamental, related concepts in geospatial data. Scale has multiple meanings depending on context, both within geographic information science and in other disciplines. Typically it refers to relative proportions between objects in the real world and their representations. Generalization is the act of modifying detail, usually reducing it, in geospatial data. It is often driven by a need to represent data at coarsened resolution, being typically a consequence of reducing representation scale. Multiple computations and graphical modication processes can be used to achieve generalization, each introducing increased abstraction to the data, its symbolization, or both.

DM-85 - Point, Line, and Area Generalization
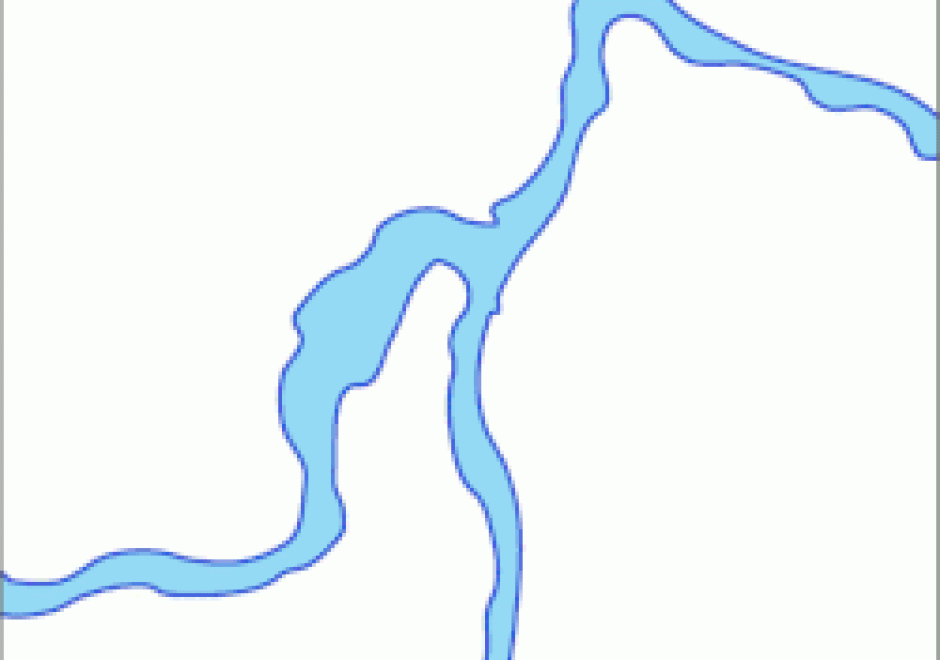
Generalization is an important and unavoidable part of making maps because geographic features cannot be represented on a map without undergoing transformation. Maps abstract and portray features using vector (i.e. points, lines and polygons) and raster (i.e pixels) spatial primitives which are usually labeled. These spatial primitives are subjected to further generalization when map scale is changed. Generalization is a contradictory process. On one hand, it alters the look and feel of a map to improve overall user experience especially regarding map reading and interpretive analysis. On the other hand, generalization has documented quality implications and can sacrifice feature detail, dimensions, positions or topological relationships. A variety of techniques are used in generalization and these include selection, simplification, displacement, exaggeration and classification. The techniques are automated through computer algorithms such as Douglas-Peucker and Visvalingam-Whyatt in order to enhance their operational efficiency and create consistent generalization results. As maps are now created easily and quickly, and used widely by both experts and non-experts owing to major advances in IT, it is increasingly important for virtually everyone to appreciate the circumstances, techniques and outcomes of generalizing maps. This is critical to promoting better map design and production as well as socially appropriate uses.

AM-94 - Machine Learning Approaches

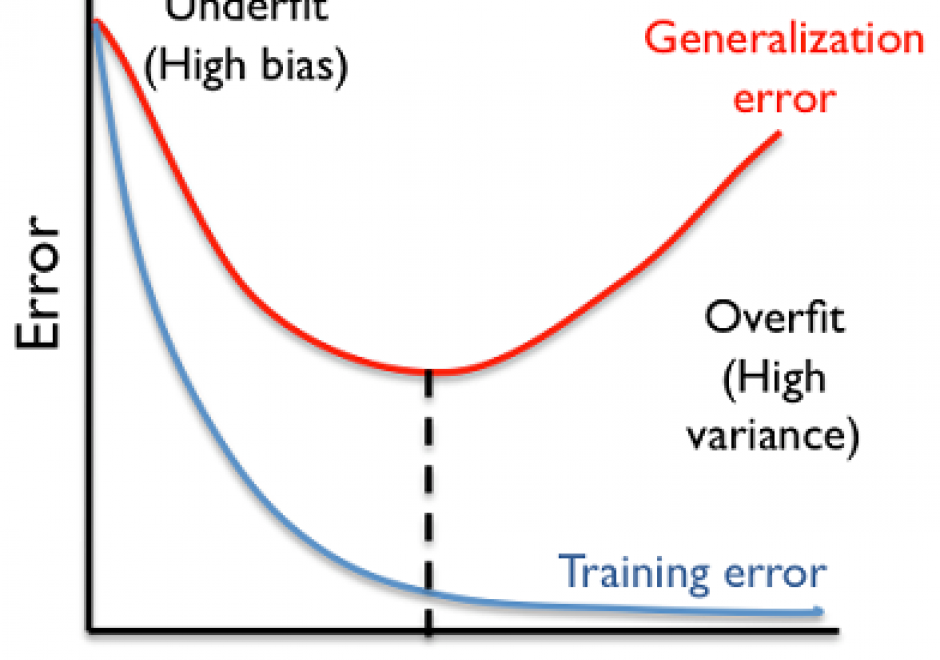
Machine learning approaches are increasingly used across numerous applications in order to learn from data and generate new knowledge discoveries, advance scientific studies and support automated decision making. In this knowledge entry, the fundamentals of Machine Learning (ML) are introduced, focusing on how feature spaces, models and algorithms are being developed and applied in geospatial studies. An example of a ML workflow for supervised/unsupervised learning is also introduced. The main challenges in ML approaches and our vision for future work are discussed at the end.

CV-21 - Map Reading

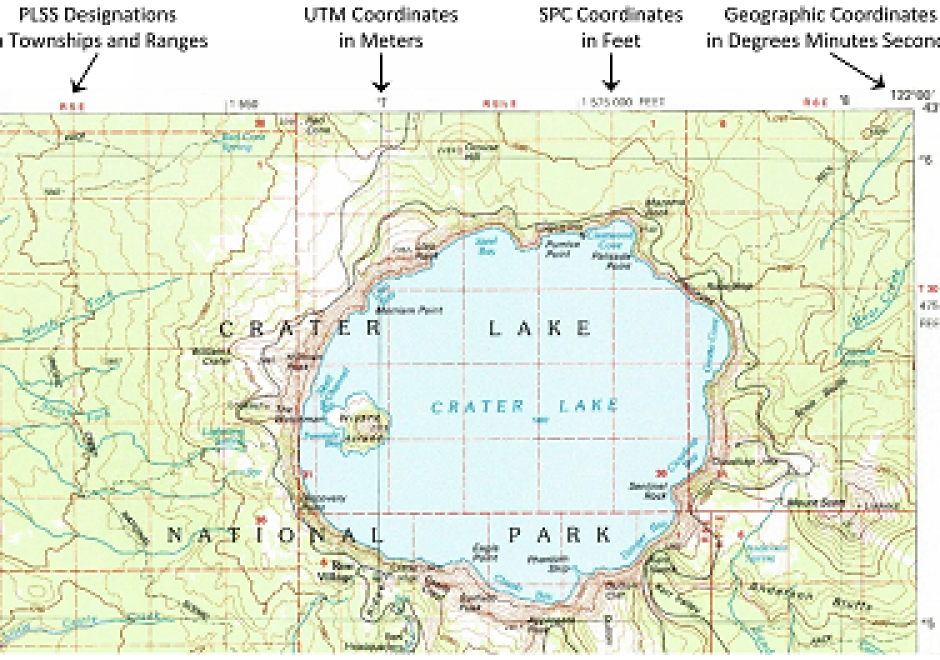
Map reading is the process of looking at the map to determine what is depicted and how the cartographer depicted it. This involves identifying the features or phenomena portrayed, the symbols and labels used, and information about the map that may not be displayed on the map. Reading maps accurately and effectively requires at least a basic understanding of how the mapmaker has made important cartographic decisions relating to map scale, map projections, coordinate systems, and cartographic compilation (selection, classification, generalization, and symbolization). Proficient map readers also appreciate artifacts of the cartographic compilation process that improve readability but may also affect map accuracy and uncertainty. Masters of map reading use maps to gain better understanding of their environment, develop better mental maps, and ultimately make better decisions. Through successful map reading, a person’s cartographic and mental maps will merge to tune the reader’s spatial thinking to the reality of the environment.

CV-29 - Design and Aesthetics

Design and aesthetics are fundamental to cartographic practice. Developing students’ skills in design and aesthetics is a critical part of cartography education, yet design is also one of the most difficult part of the cartographic process. The cartographic design process of planning, creating, critiquing, and revising maps provides a method for making maps with intentional design decisions, utilizing an understanding of aesthetics to promote clarity and cohesion to attract the user and facilitate an emotional response. In this entry, cartographic design and the cartographic design process are reviewed, and the concepts of aesthetics, style, and taste are explained in the context of cartographic design.

AM-21 - The Evolution of Geospatial Reasoning, Analytics, and Modeling

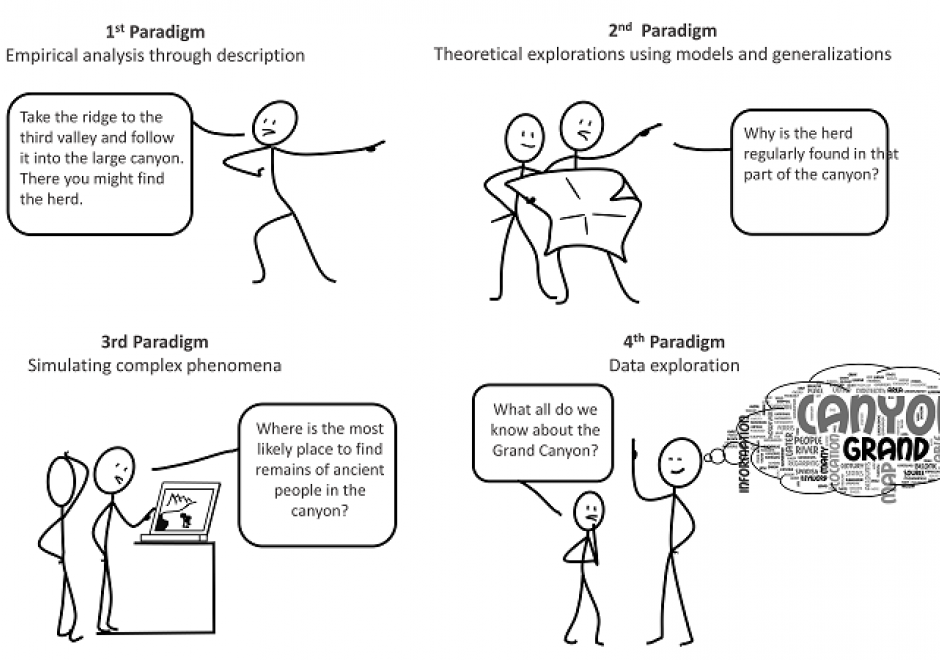
The field of geospatial analytics and modeling has a long history coinciding with the physical and cultural evolution of humans. This history is analyzed relative to the four scientific paradigms: (1) empirical analysis through description, (2) theoretical explorations using models and generalizations, (3) simulating complex phenomena and (4) data exploration. Correlations among developments in general science and those of the geospatial sciences are explored. Trends identify areas ripe for growth and improvement in the fourth and current paradigm that has been spawned by the big data explosion, such as exposing the ‘black box’ of GeoAI training and generating big geospatial training datasets. Future research should focus on integrating both theory- and data-driven knowledge discovery.

CV-40 - Mobile Maps and Responsive Design

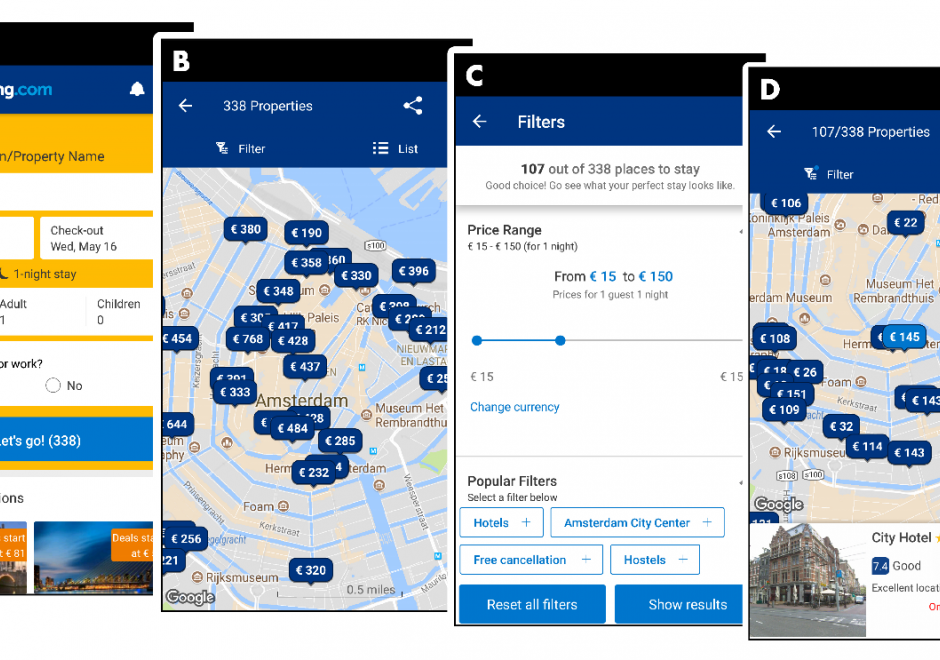
Geographic information increasingly is produced and consumed on mobile devices. The rise of mobile mapping is challenging traditional design conventions in research, industry, and education, and cartographers and GIScientists now need to accommodate this mobile context. This entry introduces emerging design considerations for mobile maps. First, the technical enablements and constraints that make mobile devices unique are described, including Global Positioning System (GPS) receivers and other sensors, reduced screensize and resolution, reduced processing power and memory capacity, less reliable data connectivity, reduced bandwidth, and physical mobility through variable environmental conditions. Scholarly influences on mobile mapping also are reviewed, including location-based services, adaptive cartography, volunteered geographic information, and locational privacy. Next, two strategies for creating mobile maps are introduced—mobile apps installed onto mobile operating systems versus responsive web maps that work on mobile and nonmobile devices—and core concepts of responsive web design are reviewed, including fluid grids, media queries, breakpoints, and frameworks. Finally, emerging design recommendations for mobile maps are summarized, with representation design adaptations needed to account for reduced screensizes and bandwidth and interaction design adaptations needed to account for multi-touch interaction and post-WIMP interfaces.

CV-05 - Statistical Mapping (Enumeration, Normalization, Classification)

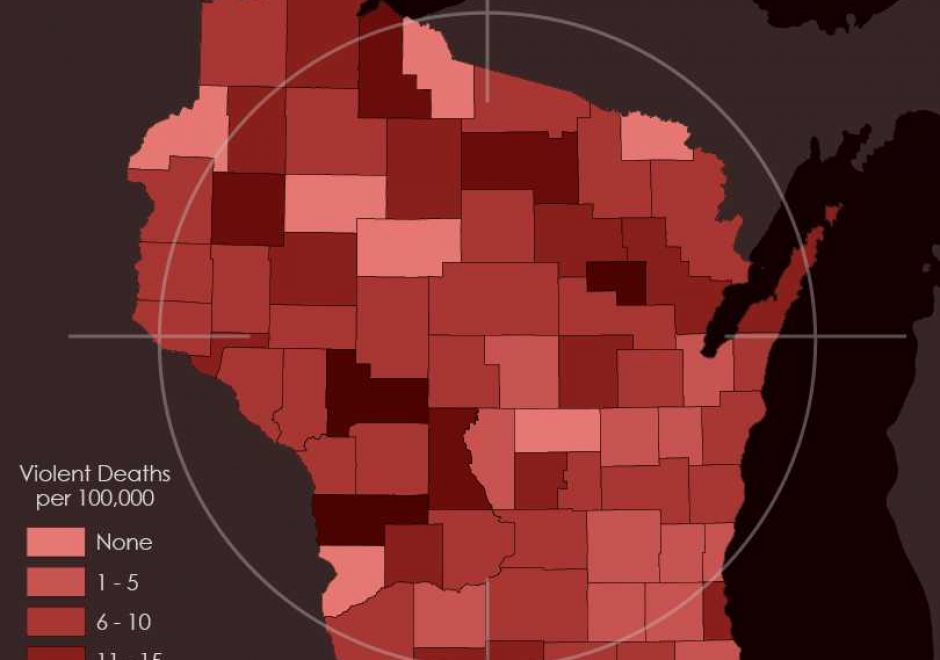
Proper communication of spatial distributions, trends, and patterns in data is an important component of a cartographers work. Geospatial data is often large and complex, and due to inherent limitations of size, scalability, and sensitivity, cartographers are often required to work with data that is abstracted, aggregated, or simplified from its original form. Working with data in this manner serves to clarify cartographic messages, expedite design decisions, and assist in developing narratives, but it also introduces a degree of abstraction and subjectivity in the map that can make it easy to infer false messages from the data and ultimately can mislead map readers. This entry introduces the core topics of statistical mapping around cartography. First, we define enumeration and the aggregation of data to units of enumeration. Next, we introduce the importance of data normalization (or standardization) to more truthfully communicate cartographically and, lastly, discuss common methods of data classification and how cartographers bin data into groups that simplify communication.

AM-97 - An Introduction to Spatial Data Mining

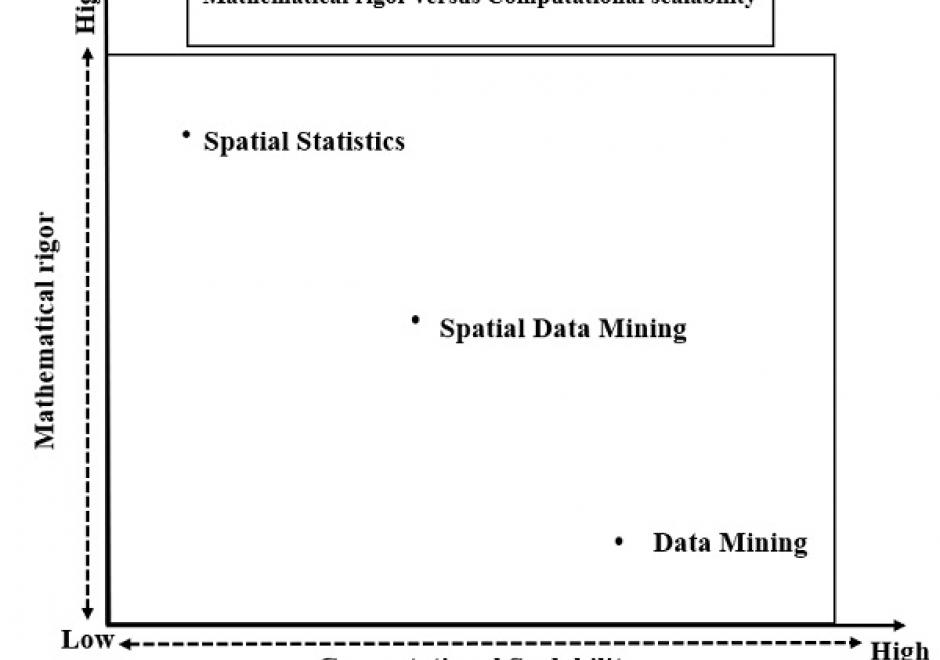
The goal of spatial data mining is to discover potentially useful, interesting, and non-trivial patterns from spatial data-sets (e.g., GPS trajectory of smartphones). Spatial data mining is societally important having applications in public health, public safety, climate science, etc. For example, in epidemiology, spatial data mining helps to nd areas with a high concentration of disease incidents to manage disease outbreaks. Computational methods are needed to discover spatial patterns since the volume and velocity of spatial data exceed the ability of human experts to analyze it. Spatial data has unique characteristics like spatial autocorrelation and spatial heterogeneity which violate the i.i.d (Independent and Identically Distributed) assumption of traditional statistic and data mining methods. Therefore, using traditional methods may miss patterns or may yield spurious patterns, which are costly in societal applications. Further, there are additional challenges such as MAUP (Modiable Areal Unit Problem) as illustrated by a recent court case debating gerrymandering in elections. In this article, we discuss tools and computational methods of spatial data mining, focusing on the primary spatial pattern families: hotspot detection, collocation detection, spatial prediction, and spatial outlier detection. Hotspot detection methods use domain information to accurately model more active and high-density areas. Collocation detection methods find objects whose instances are in proximity to each other in a location. Spatial prediction approaches explicitly model the neighborhood relationship of locations to predict target variables from input features. Finally, spatial outlier detection methods find data that differ from their neighbors. Lastly, we describe future research and trends in spatial data mining.

CV-08 - Symbolization and the Visual Variables

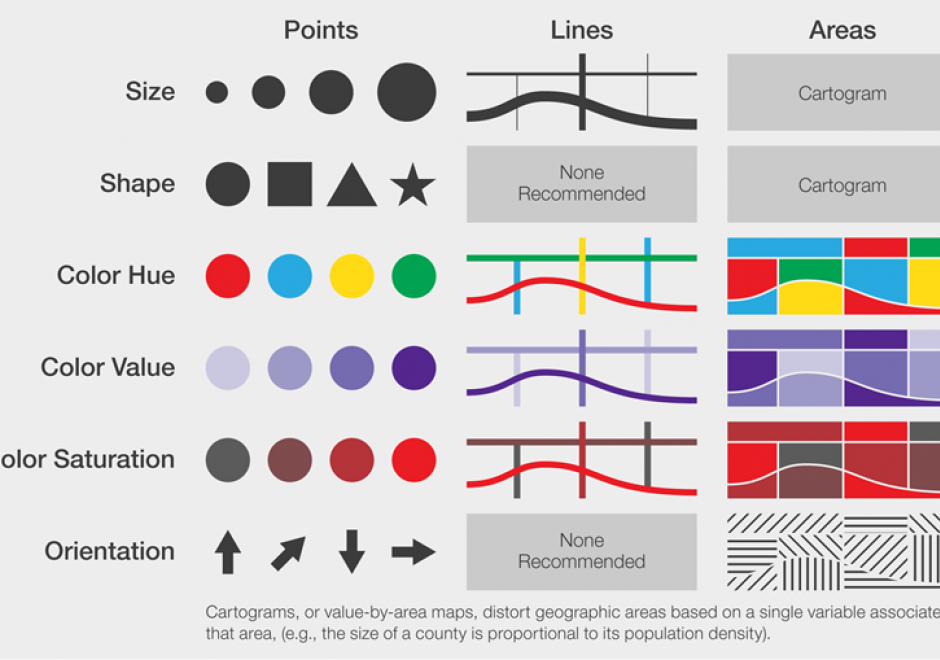
Maps communicate information about the world by using symbols to represent specific ideas or concepts. The relationship between a map symbol and the information that symbol represents must be clear and easily interpreted. The symbol design process requires first an understanding of the underlying nature of the data to be mapped (e.g., its spatial dimensions and level of measurement), then the selection of symbols that suggest those data attributes. Cartographers developed the visual variable system, a graphic vocabulary, to express these relationships on maps. Map readers respond to the visual variable system in predictable ways, enabling mapmakers to design map symbols for most types of information with a high degree of reliability.

Pages