Search Page

Showing 21 - 30 of 34
CV-28 - Lesson Design in Cartography Education

This entry describes six general variables of lesson design in cartography education and offers some practical advice for the development of materials for teaching cartography. First, a lesson’s scope concerns the set of ideas included in a lesson and helps identify different types of lessons based on the kinds of knowledge that they contain. Second, learning objectives concern the things that students should be able to do following a lesson and relate to different cognitive processes of learning. Third, a lesson’s scheme deals with the organizational framework for delivering content. Fourth, a lesson’s guidance concerns the amount and quality of supportive information provided. Fifth, a lesson’s sequence may involve one or more strategies for ordering content. Sixth, a lesson’s activity concerns what students do during a lesson and is often associated with different learning outcomes. These six variables help differentiate traditions for teaching cartography, elucidate some of the recurring challenges in cartography education, and offer strategies for designing lessons to foster meaningful learning outcomes.

CV-31 - Flow Maps

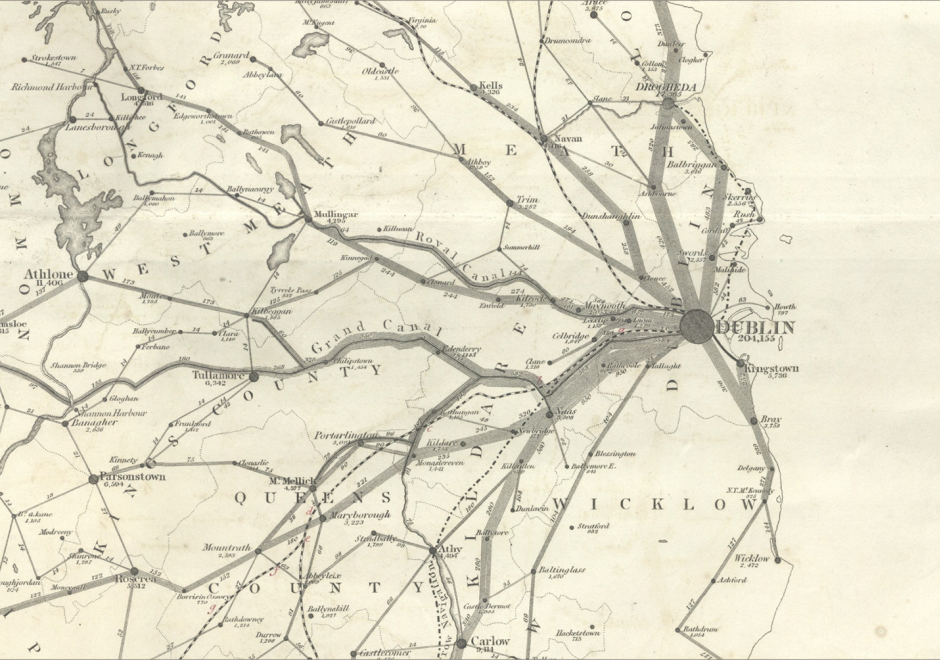
Flow mapping is a cartographic method of representing movement of phenomena. Maps of this type often depict the vector movement of entities (imports and exports, people, information) between geographic areas, but the general method also encompasses a range of graphics illustrating networks (e.g., transit and communications grids) and dynamic systems (e.g., wind and water currents). Most flow maps typically use line symbols of varying widths, lengths, shapes, colors, or speeds (in the case of animated flow maps) to show the quality, direction, and magnitude of movements. Aesthetic considerations for flow maps are numerous and their production is often done manually without significant automation. Flow maps frequently use distorted underlying geography to accommodate the placement of flow paths, which are often dramatically smoothed/abstracted into visually pleasing curves or simply straight lines. In the extreme, such maps lack a geographic coordinate space and are more diagrammatic, as in Sankey diagrams, alluvial diagrams, slope graphs, and circle migration plots. Whatever their form, good flow maps should effectively visualize the relative magnitude and direction of movement or potential movement between a one or more origins and destinations.

AM-106 - Error-based Uncertainty

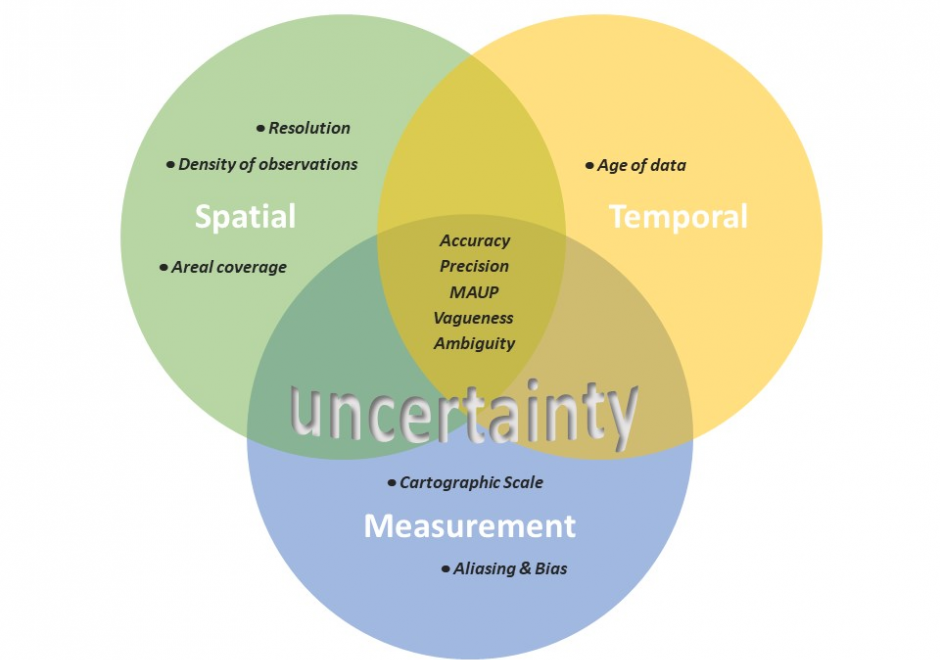
The largest contributing factor to spatial data uncertainty is error. Error is defined as the departure of a measure from its true value. Uncertainty results from: (1) a lack of knowledge of the extent and of the expression of errors and  (2) their propagation through analyses. Understanding error and its sources is key to addressing error-based uncertainty in geospatial practice. This entry presents a sample of issues related to error and error based uncertainty in spatial data. These consist of (1) types of error in spatial data, (2) the special case of scale and its relationship to error and (3) approaches to quantifying error in spatial data.

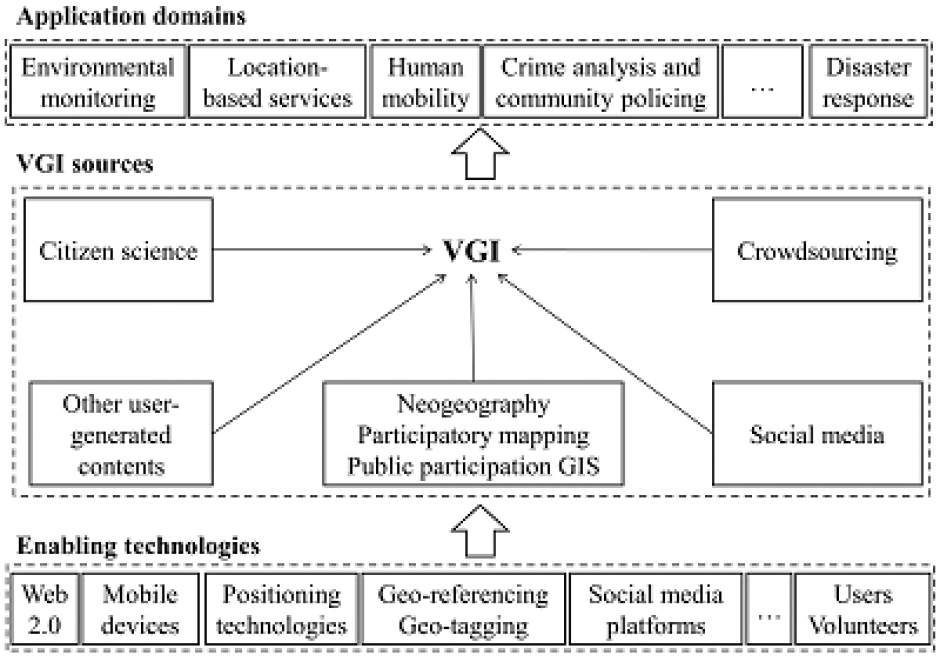
DC-29 - Volunteered Geographic Information

Volunteered geographic information (VGI) refers to geo-referenced data created by citizen volunteers. VGI has proliferated in recent years due to the advancement of technologies that enable the public to contribute geographic data. VGI is not only an innovative mechanism for geographic data production and sharing, but also may greatly influence GIScience and geography and its relationship to society. Despite the advantages of VGI, VGI data quality is under constant scrutiny as quality assessment is the basis for users to evaluate its fitness for using it in applications. Several general approaches have been proposed to assure VGI data quality but only a few methods have been developed to tackle VGI biases. Analytical methods that can accommodate the imperfect representativeness and biases in VGI are much needed for inferential use where the underlying phenomena of interest are inferred from a sample of VGI observations. VGI use for inference and modeling adds much value to VGI. Therefore, addressing the issue of representativeness and VGI biases is important to fulfill VGI’s potential. Privacy and security are also important issues. Although VGI has been used in many domains, more research is desirable to address the fundamental intellectual and scholarly needs that persist in the field.

FC-14 - Directional Operations

In the same manner as distance, direction plays an equally important role in GIS. This article first summarizes different ways of measuring direction, either quantitatively or qualitatively. Formulas and examples are provided. In the following discussion, fundamental differences between distance and direction in describing spatial relations is examined; properties of angles are emphasized in the context of GIS; and the classification of both cardinal and projective direction is illustrated. With a focus on quantitative operations, various directional operations are categorized and elaborated based on factors such as the underlying data model (vector or raster) and whether direction effect is explicitly or implicitly embedded in the data.

DC-25 - Changes in Geospatial Data Capture Over Time: Part 1, Technological Developments

Geographic Information Systems (GIS) are fueled by geospatial data.  This comprehensive article reviews the evolution of procedures and technologies used to create the data that fostered the explosion of GIS applications. It discusses the need to geographically reference different types of information to establish an integrated computing environment that can address a wide range of questions. This includes the conversion of existing maps and aerial photos into georeferenced digital data.  It covers the advancements in manual digitizing procedures and direct digital data capture. This includes the evolution of software tools used to build accurate data bases. It also discusses the role of satellite based multispectral scanners for Earth observation and how LiDAR has changed the way that we measure and represent the terrain and structures. Other sections deal with building GIS data directly from street addresses and the construction of parcels to support land record systems. It highlights the way Global Positioning Systems (GPS) technology coupled with wireless networks and cloud-based applications have spatially empowered millions of users. This combination of technology has dramatically affected the way individuals search and navigate in their daily lives while enabling citizen scientists to be active participants in the capture of spatial data. For further information on changes to data capture, see Part 2: Implications and Case Studies. 

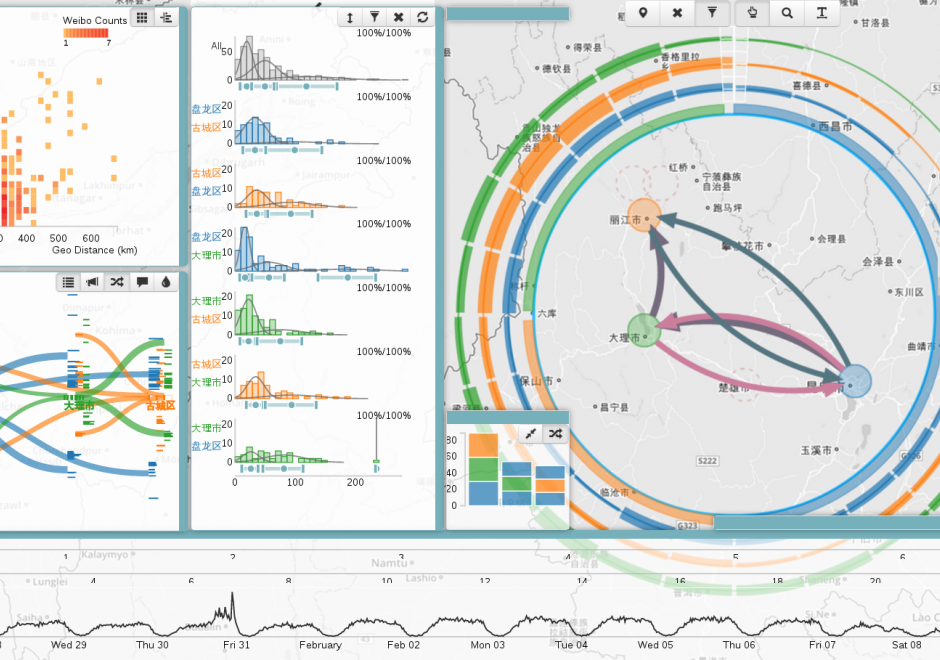
CV-19 - Big Data Visualization

As new information and communication technologies have altered so many aspects of our daily lives over the past decades, they have simultaneously stimulated a shift in the types of data that we collect, produce, and analyze. Together, this changing data landscape is often referred to as "big data." Big data is distinguished from "small data" not only by its high volume but also by the velocity, variety, exhaustivity, resolution, relationality, and flexibility of the datasets. This entry discusses the visualization of big spatial datasets. As many such datasets contain geographic attributes or are situated and produced within geographic space, cartography takes on a pivotal role in big data visualization. Visualization of big data is frequently and effectively used to communicate and present information, but it is in making sense of big data – generating new insights and knowledge – that visualization is becoming an indispensable tool, making cartography vital to understanding geographic big data. Although visualization of big data presents several challenges, human experts can use visualization in general, and cartography in particular, aided by interfaces and software designed for this purpose, to effectively explore and analyze big data.

FC-10 - GIS Data Properties

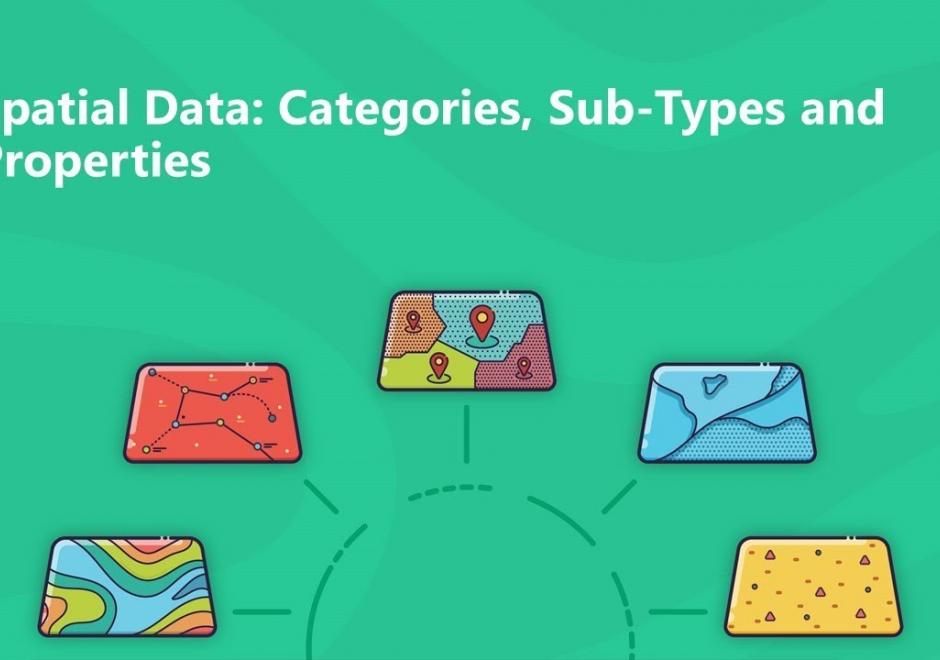
Data properties are characteristics of GIS attribute systems and values whose design and format impacts analytical and computational processing.  Geospatial data are expressed at conceptual, logical, and physical levels of database abstraction intended to represent geographical information. The appropriate design of attribute systems and selection of properties should be logically consistent and support appropriate scales of measurement for representation and analysis. Geospatial concepts such as object-field views and dimensional space for relating objects and qualities form data models based on a geographic matrix and feature geometry. Three GIS approaches and their attribute system design are described: tessellations, vectors, and graphs.

CV-11 - Common Thematic Map Types

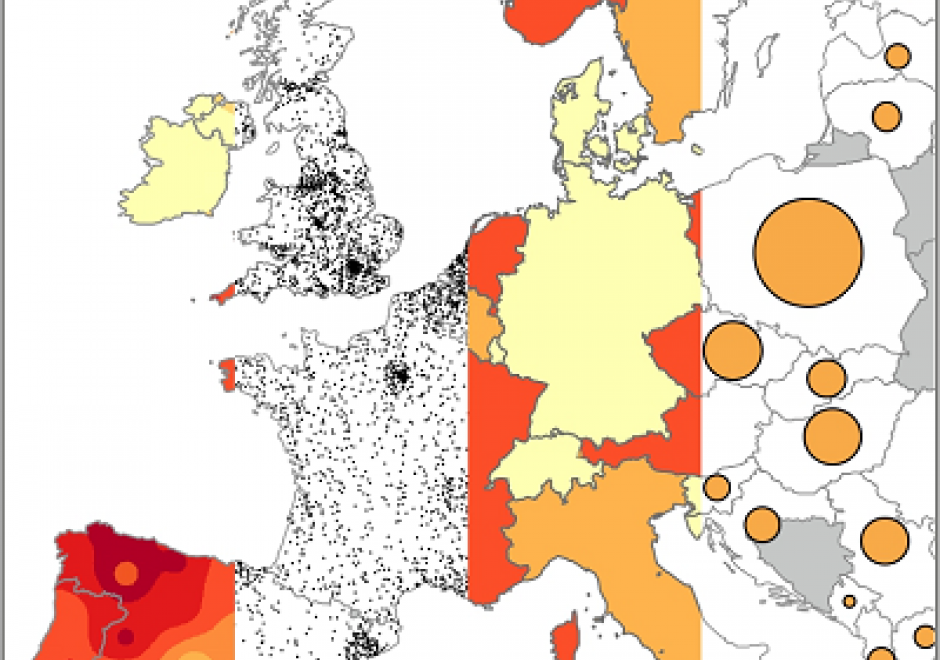
Thematic maps cover a wide variety of mapping solutions, and include choropleth, proportional symbol, isoline, dot density, dasymetric, and flow maps as well as cartograms, among others. Each thematic map type requires a different data processing method and employs different visual variables, resulting in representations that are either continuous or discrete and smooth or abrupt. As a result, each solution highlights different aspects of the mapped phenomena and shapes the message for the map readers differently. Thematic maps are tools for understanding spatial patterns, and the choice of thematic map type should support this understanding. Therefore, the main consideration when selecting a thematic map type is the purpose of the map and the nature of the underlying spatial patterns.

This entry reviews the common types of thematic maps, describes the visual variables that are applied in them, and provides design considerations for each thematic map type, including their legends. It also provides an overview of the relative strengths and limitations of each thematic map type.

CV-10 - Typography

The selection of appropriate type on maps, far from an arbitrary design decision, is an integral part of establishing the content and tone of the map. Typefaces have personalities, which contribute to the rhetorical message of the map. It is important to understand how to assess typefaces for their personalities, but also to understand which typefaces may be more or less legible in a labeling context. Beyond the choice of typeface, effective map labels will have a visual hierarchy and allow the user to easily associate labels to their features and feature types. The cartographer must understand and modify typographic visual variables to support both the hierarchy and label-feature associations.

Pages