2018 QUARTER 02

A B C D E F G H I K L M N O P R S T U V W
DM-54 - Map projection classes
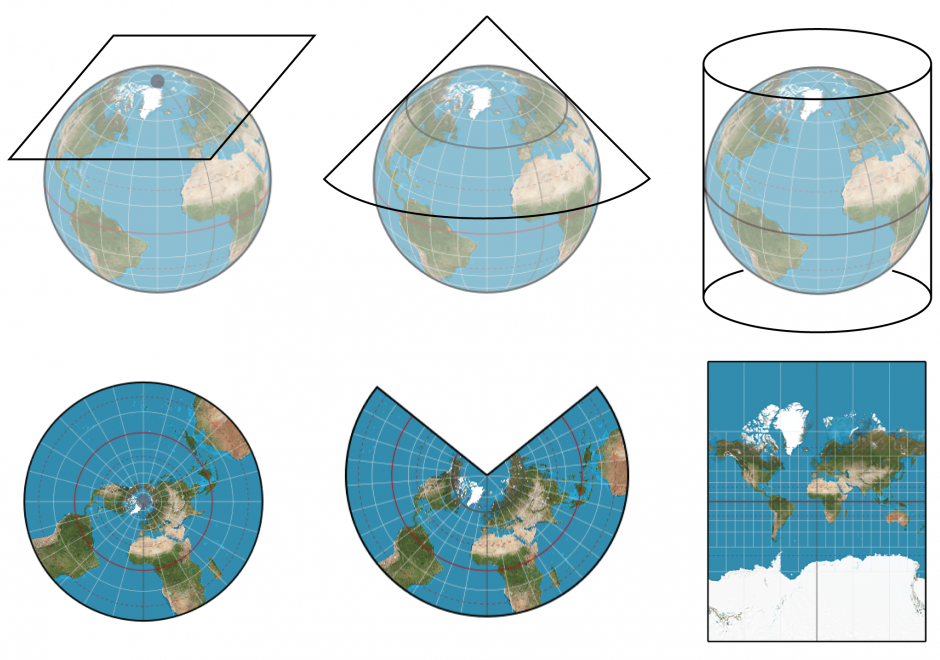
  • Explain the concepts “developable surface” and “reference globe” as ways of projecting the Earth’s surface
  • Explain the mathematical basis by which latitude and longitude locations are projected into x and y coordinate space
  • Illustrate the graticule configurations for “other” projection classes, such as polyconic, pseudocylindrical, etc.
  • Classify various map projection types according to the geometric properties preserved
  • Classify various map projection types by the three main classes of map projections based on developable surfaces
DM-55 - Map projection parameters
  • Explain how the concepts of the tangent and secant cases relate to the idea of a standard line
  • Implement a given map projection formula in a software program that reads geographic coordinates as input and produces projected (x, y) coordinates as output
  • Identify the parameters that allow one to focus a projection on an area of interest
  • Use GIS software to produce a graticule that matches a target graticule
  • Identify the possible “aspects” of a projection and describe the graticule’s appearance in each aspect
  • Define key terms such as “standard line,” “projection case,” and “latitude and longitude of origin”
DM-53 - Map projection properties
  • Describe the visual appearance of the Earth’s graticule
  • Discuss what a Tissot indicatrix represents and how it can be used to assess projection-induced error
  • Interpret a given a projected graticule, continent outlines, and indicatrixes at each graticule intersection in terms of geometric properties preserved and distorted
  • Illustrate distortion patterns associated with a given projection class
  • Recognize distortion patterns on a map based upon the graticule arrangement
  • Explain the kind of distortion that occurs when raster data are projected
  • Explain the rationale for the selection of the geometric property that is preserved in map projections used as the basis of the UTM and SPC systems
  • Recommend the map projection property that would be useful for various mapping applications, including parcel mapping, route mapping, etc., and justify your recommendations
  • Define the four geometric properties of the globe that may be preserved or lost in projected coordinates
  • Explain the concept of a “compromise” projection and for which purposes it is useful
CV-06 - Map Projections

Map projection is the process of transforming angular (spherical / elliptical) coordinates into planar coordinates. All map projections introduce distortion (e.g., to areas, angles, distances) in the resulting planar coordinates. Understanding what, where, and how much distortion is introduced is an important consideration for spatial computations and visual interpretation of spatial patterns, as well as for general aesthetics of any map.

CV-21 - Map reading
  • Discuss the advantages and disadvantages of using conventional symbols (e.g., blue=water, green=vegetation, Swiss cross=a hospital) on a map
  • Find specified features on a topographic map (e.g., gravel pit, mine entrance, well, land grant)
  • Match map labels to the corresponding features
  • Match the symbols on a map to the corresponding explanations in the legend
  • Execute a well designed legend that facilitates map reading
  • Explain how the anatomy of the eye and its visual sensor cells affect how one sees maps in terms of attention, acuity, focus, and color
  • Explain how memory limitations effect map reading tasks
CV-17 - Mapping Time
  • Describe how the adding time-series data reveals or does not reveal patterns not evident in a cross-sectional data
  • Describe how an animated map reveals patterns not evident without animation
  • Demonstrate how Bertin’s “graphic variables” can be extended to include animation effects
  • Create a temporal sequence representing a dynamic geospatial process
AM-45 - Mathematical modeling
  • Explain how optimization models can be used to generate models of alternate options for presentation to decision makers
  • Explain, using the concept of combinatorial complexity, why some location problems are very hard to solve
  • Compare and contrast the concepts of discrete location problems and continuous location problems
  • Explain the concept of solution space
  • Explain the principles of operations research modeling and location modeling
AM-48 - Mathematical models of uncertainty: probability and statistics
  • Devise simple ways to represent probability information in GIS
  • Describe the basic principles of randomness and probability
  • Compute descriptive statistics and geostatistics of geographic data
  • Interpret descriptive statistics and geostatistics of geographic data
  • Recognize the assumptions underlying probability and geostatistics and the situations in which they are useful analytical tools
DM-31 - Mathematical models of vagueness: Fuzzy sets and rough sets
  • Compare and contrast the relative merits of fuzzy sets, rough sets, and other models
  • Differentiate between fuzzy set membership and probabilistic set membership
  • Explain the problems inherent in fuzzy sets
  • Create appropriate membership functions to model vague phenomena
KE-17 - Measuring costs
  • Explain how the saying “developing data is the largest single cost of implementing GIS” could be true for an organization that is already collecting data as part of its regular operations
  • Describe some non-fiduciary barriers to GIS implementation
  • Summarize what the literature suggests as means for overcoming some of the non-fiduciary barriers to GIS implementation
  • Outline sources of additional costs associated with development of an enterprise GIS
  • Outline the categories of costs that an organization should anticipate as it plans to design and implement a GIS

Pages