CP-27 - GIS and Computational Notebooks
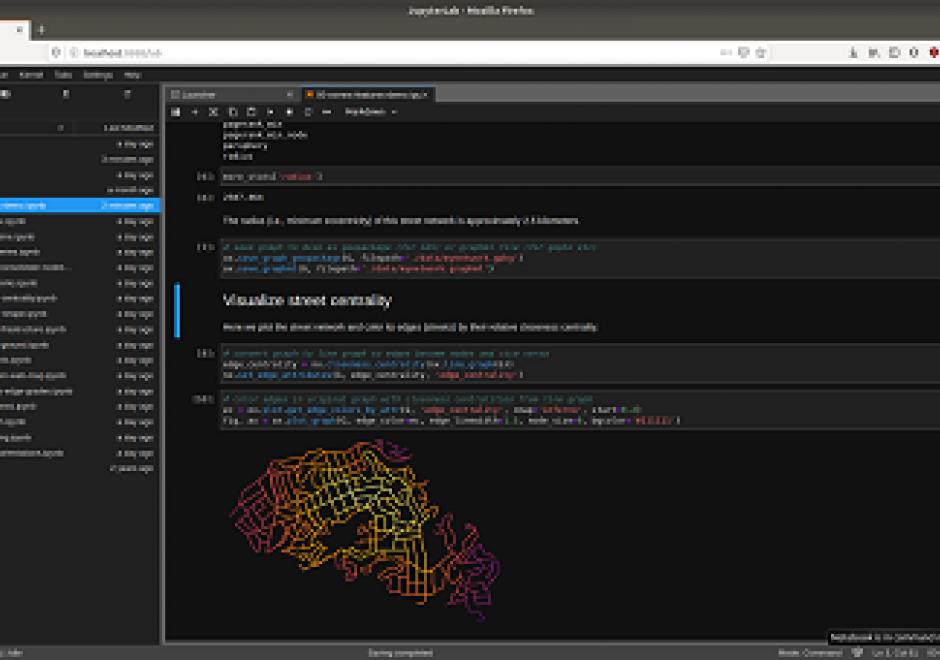
Researchers and practitioners across many disciplines have recently adopted computational notebooks to develop, document, and share their scientific workflows—and the GIS community is no exception. This chapter introduces computational notebooks in the geographical context. It begins by explaining the computational paradigm and philosophy that underlie notebooks. Next it unpacks their architecture to illustrate a notebook user’s typical workflow. Then it discusses the main benefits notebooks offer GIS researchers and practitioners, including better integration with modern software, more natural access to new forms of data, and better alignment with the principles and benefits of open science. In this context, it identifies notebooks as the “glue” that binds together a broader ecosystem of open source packages and transferable platforms for computational geography. The chapter concludes with a brief illustration of using notebooks for a set of basic GIS operations. Compared to traditional desktop GIS, notebooks can make spatial analysis more nimble, extensible, and reproducible and have thus evolved into an important component of the geospatial science toolkit.

CV-35 - Geovisualization
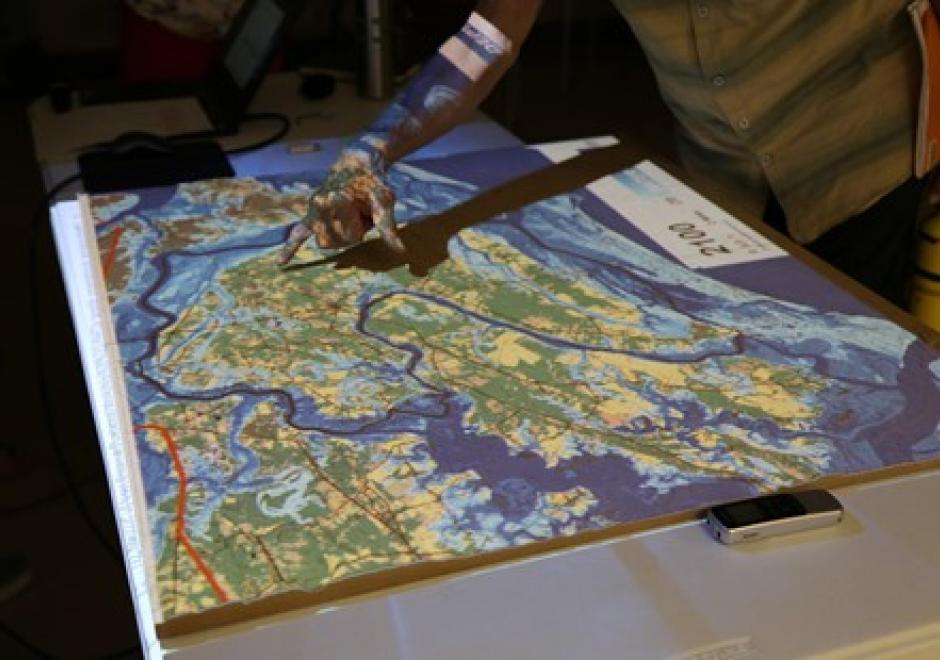
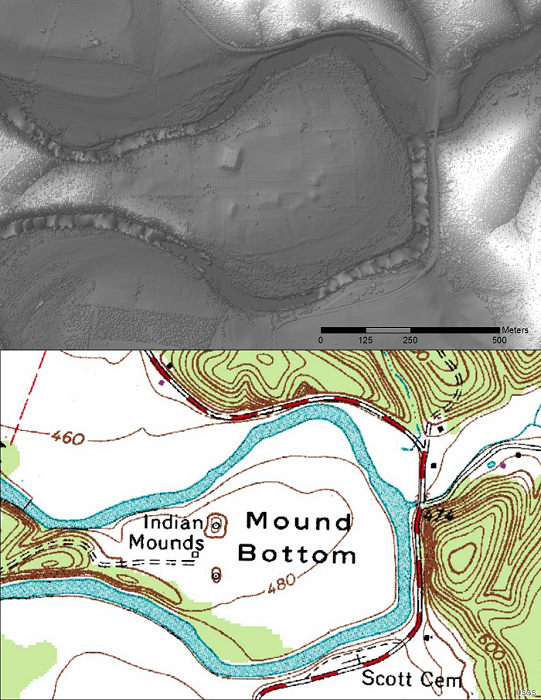
Geovisualization is primarily understood as the process of interactively visualizing geographic information in any of the steps in spatial analyses, even though it can also refer to the visual output (e.g., plots, maps, combinations of these), or the associated techniques. Rooted in cartography, geovisualization emerged as a research thrust with the leadership of Alan MacEachren (Pennsylvania State University) and colleagues when interactive maps and digitally-enabled exploratory data analysis led to a paradigm shift in 1980s and 1990s. A core argument for geovisualization is that visual thinking using maps is integral to the scientific process and hypothesis generation, and the role of maps grew beyond communicating the end results of an analysis or documentation process. As such, geovisualization interacts with a number of disciplines including cartography, visual analytics, information visualization, scientific visualization, statistics, computer science, art-and-design, and cognitive science; borrowing from and contributing to each. In this entry, we provide a definition and a brief history of geovisualization including its fundamental concepts, elaborate on its relationship to other disciplines, and briefly review the skills/tools that are relevant in working with geovisualization environments. We finish the entry with a list of learning objectives, instructional questions, and additional resources.